Identify the lower class limits, upper class limits, class width, class midpoints, and class boundaries for the given frequency distribution. Also identify the number of individuals included in the summary. Age (yr) when award was won Frequency O 25-34 35-44 45-54 55-64 65-74 75-84 85-94 27 35 15 3 Identify the lower class limits. (Type integers or decimals. Do not round. Use ascending order.) Identify the upper class limits. 00 (Type integers or decimals. Do not round. Use ascending order.) Identify the class width. (Type an integer or a decimal. Do not round.) Identify the class midpoints. Enter your answer in each of the answer boxes.
Identify the lower class limits, upper class limits, class width, class midpoints, and class boundaries for the given frequency distribution. Also identify the number of individuals included in the summary. Age (yr) when award was won Frequency O 25-34 35-44 45-54 55-64 65-74 75-84 85-94 27 35 15 3 Identify the lower class limits. (Type integers or decimals. Do not round. Use ascending order.) Identify the upper class limits. 00 (Type integers or decimals. Do not round. Use ascending order.) Identify the class width. (Type an integer or a decimal. Do not round.) Identify the class midpoints. Enter your answer in each of the answer boxes.

Glencoe Algebra 1, Student Edition, 9780079039897, 0079039898, 2018
18th Edition
ISBN:9780079039897
Author:Carter
Publisher:Carter
Chapter10: Statistics
Section10.5: Comparing Sets Of Data
Problem 18PPS

Related questions
Question
100%
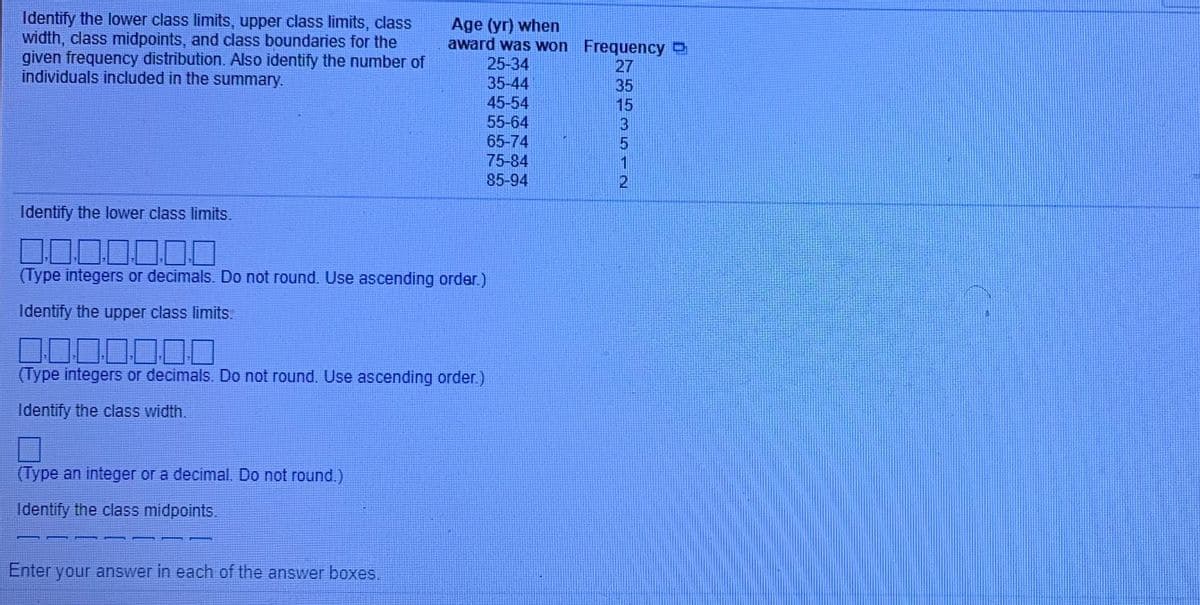
Transcribed Image Text:Identify the lower class limits, upper class limits, class
width, class midpoints, and class boundaries for the
given frequency distribution. Also identify the number of
individuals included in the summary.
Age (yr) when
award was won Frequency
25-34
35-44
45-54
27
35
15
55-64
65-74
75-84
85-94
Identify the lower class limits.
00
(Type integers or decimals. Do not round. Use ascending order.)
Identify the upper class limits.
DO00000
(Type integers or decimals. Do not round. Use ascending order.)
Identify the class width.
(Type an integer or a decimal. Do not round.)
Identify the class midpoints.
Enter your answer in each of the answer boxes,
3512
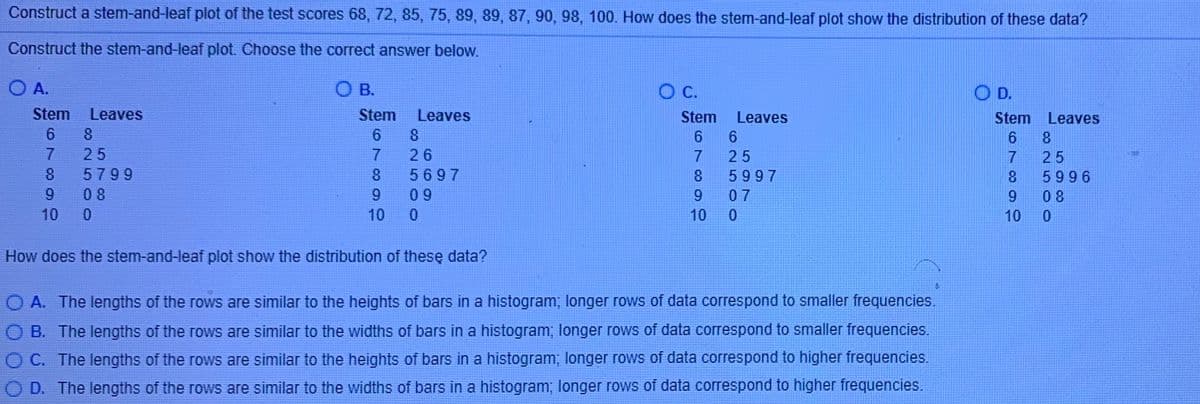
Transcribed Image Text:Construct a stem-and-leaf plot of the test scores 68, 72, 85, 75, 89, 89, 87, 90, 98, 100. How does the stem-and-leaf plot show the distribution of these data?
Construct the stem-and-leaf plot. Choose the correct answer below.
O A.
O B.
C.
O D.
TE
Stem
Leaves
Stem
Leaves
Stem
Leaves
Stem Leaves
6 8
8
25
26
25
25
5799
5697
8.
5997
5996
6.
08
0 9
9
07
9.
08
10
10
10
10
How does the stem-and-leaf plot show the distribution of thesę data?
O A. The lengths of the rows are similar to the heights of bars in a histogram; longer rows of data correspond to smaller frequencies.
B. The lengths of the rows are similar to the widths of bars in a histogram; longer rows of data correspond to smaller frequencies.
O C. The lengths of the rows are similar to the heights of bars in a histogram; longer rows of data correspond to higher frequencies.
D. The lengths of the rows are similar to the widths of bars in a histogram; longer rows of data correspond to higher frequencies.
Expert Solution
This question has been solved!
Explore an expertly crafted, step-by-step solution for a thorough understanding of key concepts.

This is a popular solution!

Trending now
This is a popular solution!

Step by step
Solved in 3 steps with 2 images

Knowledge Booster


Learn more about
Need a deep-dive on the concept behind this application? Look no further. Learn more about this topic, statistics and related others by exploring similar questions and additional content below.Recommended textbooks for you
Glencoe Algebra 1, Student Edition, 9780079039897…
Algebra
ISBN:
9780079039897
Author:
Carter
Publisher:
McGraw Hill

Holt Mcdougal Larson Pre-algebra: Student Edition…
Algebra
ISBN:
9780547587776
Author:
HOLT MCDOUGAL
Publisher:
HOLT MCDOUGAL

Big Ideas Math A Bridge To Success Algebra 1: Stu…
Algebra
ISBN:
9781680331141
Author:
HOUGHTON MIFFLIN HARCOURT
Publisher:
Houghton Mifflin Harcourt
Glencoe Algebra 1, Student Edition, 9780079039897…
Algebra
ISBN:
9780079039897
Author:
Carter
Publisher:
McGraw Hill
Holt Mcdougal Larson Pre-algebra: Student Edition…
Algebra
ISBN:
9780547587776
Author:
HOLT MCDOUGAL
Publisher:
HOLT MCDOUGAL
Big Ideas Math A Bridge To Success Algebra 1: Stu…
Algebra
ISBN:
9781680331141
Author:
HOUGHTON MIFFLIN HARCOURT
Publisher:
Houghton Mifflin Harcourt