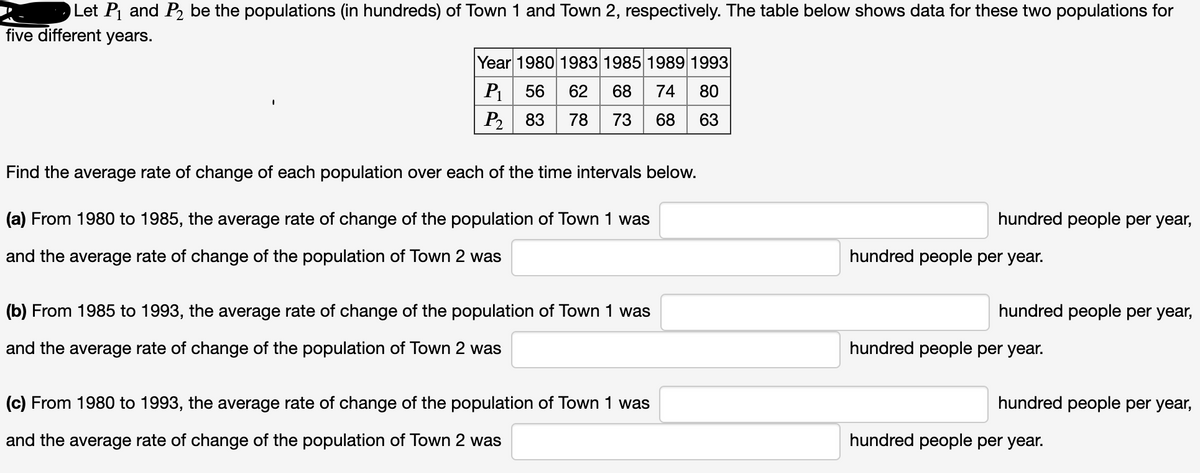
Let P¡ and P, be the populations (in hundreds) of Town 1 and Town 2, respectively. The table below shows data for these two populations for five different years. Year 1980 1983 1985 1989 1993 56 62 68 74 80 P2 83 78 73 68 63 Find the average rate of change of each population over each of the time intervals below. (a) From 1980 to 1985, the average rate of change of the population of Town 1 was hundred people per yea and the average rate of change of the population of Town 2 was hundred people per year.

College Algebra
1st Edition
ISBN:9781938168383
Author:Jay Abramson
Publisher:Jay Abramson
Chapter6: Exponential And Logarithmic Functions
Section6.8: Fitting Exponential Models To Data
Problem 3TI: Table 6 shows the population, in thousands, of harbor seals in the Wadden Sea over the years 1997 to...
icon
Related questions
icon
Concept explainers
Topic Video
Question
Let P and P2 be the populations (in hundreds) of Town 1 and Town 2, respectively. The table below shows data for these two populations for
five different years.
Year 1980 1983 1985 1989 1993
P1
56
62
68
74
80
P2
83
73
68
63
Find the average rate of change of each population over each of the time intervals below.
(a) From 1980 to 1985, the average rate of change of the population of Town 1 was
hundred people per year,
and the average rate of change of the population of Town 2 was
hundred people per year.
(b) From 1985 to 1993, the average rate of change of the population of Town 1 was
hundred people per year,
and the average rate of change of the population of Town 2 was
hundred people per year.
(c) From 1980 to 1993, the average rate of change of the population of Town 1 was
hundred people per year,
and the average rate of change of the population of Town 2 was
hundred people per year.
Transcribed Image Text:Let P and P2 be the populations (in hundreds) of Town 1 and Town 2, respectively. The table below shows data for these two populations for five different years. Year 1980 1983 1985 1989 1993 P1 56 62 68 74 80 P2 83 73 68 63 Find the average rate of change of each population over each of the time intervals below. (a) From 1980 to 1985, the average rate of change of the population of Town 1 was hundred people per year, and the average rate of change of the population of Town 2 was hundred people per year. (b) From 1985 to 1993, the average rate of change of the population of Town 1 was hundred people per year, and the average rate of change of the population of Town 2 was hundred people per year. (c) From 1980 to 1993, the average rate of change of the population of Town 1 was hundred people per year, and the average rate of change of the population of Town 2 was hundred people per year.
Expert Solution
trending now

Trending now

This is a popular solution!

steps

Step by step

Solved in 2 steps

Blurred answer
Knowledge Booster
Application of Algebra
Learn more about
Need a deep-dive on the concept behind this application? Look no further. Learn more about this topic, calculus and related others by exploring similar questions and additional content below.
Recommended textbooks for you
College Algebra
College Algebra
Algebra
ISBN:
9781938168383
Author:
Jay Abramson
Publisher:
OpenStax
Algebra & Trigonometry with Analytic Geometry
Algebra
ISBN:
9781133382119
Author:
Swokowski
Publisher:
Cengage
Trigonometry (MindTap Course List)
Trigonometry
ISBN:
9781337278461
Author:
Ron Larson
Publisher:
Cengage Learning