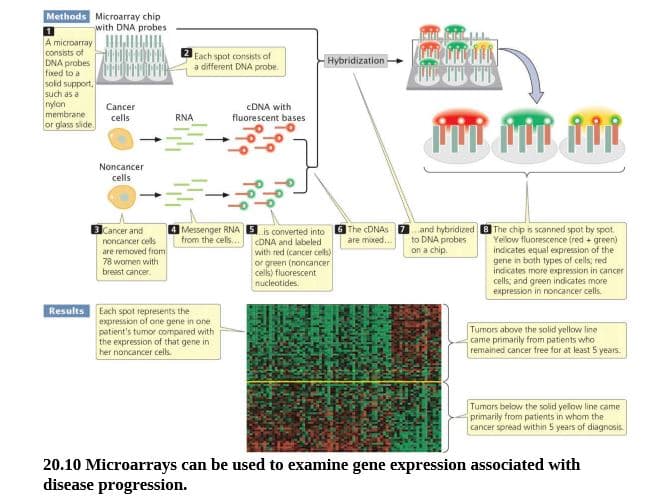
Methods Microarray chip with DNA probes A microarray consists of DNA probes fixed to a sold support, such as a nylon membrane or glass side Each spot consists of a different DNA probe. Hybridization Cancer cells CDNA with RNA fluorescent bases Noncancer cells 3Cancer and O The CDNAS 7 and hybridized 8 The chip is scanned spot by spot. Yelow fluorescence (red + green) indicates equal expression of the gene in both types of cells; red indicates more expression in cancer cells; and green indicates more expression in noncancer cells. 4 Messenger RNA B is converted into from the cels... are moxed.. to DNA probes on a chip. noncancer cells are removed from 78 wormen with breast cancer. CONA and labeled with red (cancer cels) or green (noncancer cells) fluorescent nucleotides. Results Each spot represents the expression of one gene in one patient's tumor compared with the expression of that gene in her noncancer cells. Tumors above the solid yellow line came primarily from patients who remained cancer free for at least 5 years. Tumors below the solid yellow line came primarily from patients in whom the cancer spréad within 5 years of diagnosis. 20.10 Microarrays can be used to examine gene expression associated with disease progression.
Methods Microarray chip with DNA probes A microarray consists of DNA probes fixed to a sold support, such as a nylon membrane or glass side Each spot consists of a different DNA probe. Hybridization Cancer cells CDNA with RNA fluorescent bases Noncancer cells 3Cancer and O The CDNAS 7 and hybridized 8 The chip is scanned spot by spot. Yelow fluorescence (red + green) indicates equal expression of the gene in both types of cells; red indicates more expression in cancer cells; and green indicates more expression in noncancer cells. 4 Messenger RNA B is converted into from the cels... are moxed.. to DNA probes on a chip. noncancer cells are removed from 78 wormen with breast cancer. CONA and labeled with red (cancer cels) or green (noncancer cells) fluorescent nucleotides. Results Each spot represents the expression of one gene in one patient's tumor compared with the expression of that gene in her noncancer cells. Tumors above the solid yellow line came primarily from patients who remained cancer free for at least 5 years. Tumors below the solid yellow line came primarily from patients in whom the cancer spréad within 5 years of diagnosis. 20.10 Microarrays can be used to examine gene expression associated with disease progression.

Human Heredity: Principles and Issues (MindTap Course List)
11th Edition
ISBN:9781305251052
Author:Michael Cummings
Publisher:Michael Cummings
Chapter14: Biotechnology And Society
Section: Chapter Questions
Problem 12QP: DNA Profiles as Tools for Identification A PCR-based paternity test is conducted using STRs that...

Related questions

Concept explainers
Question
Of the genes in the microarray shown in the lower part of Figure 20.10, are most overexpressed or underexpressed in tumors from patients that remained cancer free for at least five years? Explain your reasoning.
Transcribed Image Text:Methods Microarray chip
with DNA probes
A microarray
consists of
DNA probes
fixed to a
sold support,
such as a
nylon
membrane
or glass side
Each spot consists of
a different DNA probe.
Hybridization
Cancer
cells
CDNA with
RNA
fluorescent bases
Noncancer
cells
3Cancer and
O The CDNAS 7 and hybridized 8 The chip is scanned spot by spot.
Yelow fluorescence (red + green)
indicates equal expression of the
gene in both types of cells; red
indicates more expression in cancer
cells; and green indicates more
expression in noncancer cells.
4 Messenger RNA B is converted into
from the cels...
are moxed..
to DNA probes
on a chip.
noncancer cells
are removed from
78 wormen with
breast cancer.
CONA and labeled
with red (cancer cels)
or green (noncancer
cells) fluorescent
nucleotides.
Results Each spot represents the
expression of one gene in one
patient's tumor compared with
the expression of that gene in
her noncancer cells.
Tumors above the solid yellow line
came primarily from patients who
remained cancer free for at least 5 years.
Tumors below the solid yellow line came
primarily from patients in whom the
cancer spréad within 5 years of diagnosis.
20.10 Microarrays can be used to examine gene expression associated with
disease progression.
Expert Solution
This question has been solved!
Explore an expertly crafted, step-by-step solution for a thorough understanding of key concepts.

This is a popular solution!

Trending now
This is a popular solution!

Step by step
Solved in 2 steps

Knowledge Booster


Learn more about
Need a deep-dive on the concept behind this application? Look no further. Learn more about this topic, biology and related others by exploring similar questions and additional content below.Recommended textbooks for you
Human Heredity: Principles and Issues (MindTap Co…
Biology
ISBN:
9781305251052
Author:
Michael Cummings
Publisher:
Cengage Learning
Human Heredity: Principles and Issues (MindTap Co…
Biology
ISBN:
9781305251052
Author:
Michael Cummings
Publisher:
Cengage Learning