
MATLAB: An Introduction with Applications
6th Edition
ISBN: 9781119256830
Author: Amos Gilat
Publisher: John Wiley & Sons Inc
expand_more
expand_more
format_list_bulleted
Related questions
Question

Transcribed Image Text:Sure, here’s the transcript for inclusion on an educational website:
---
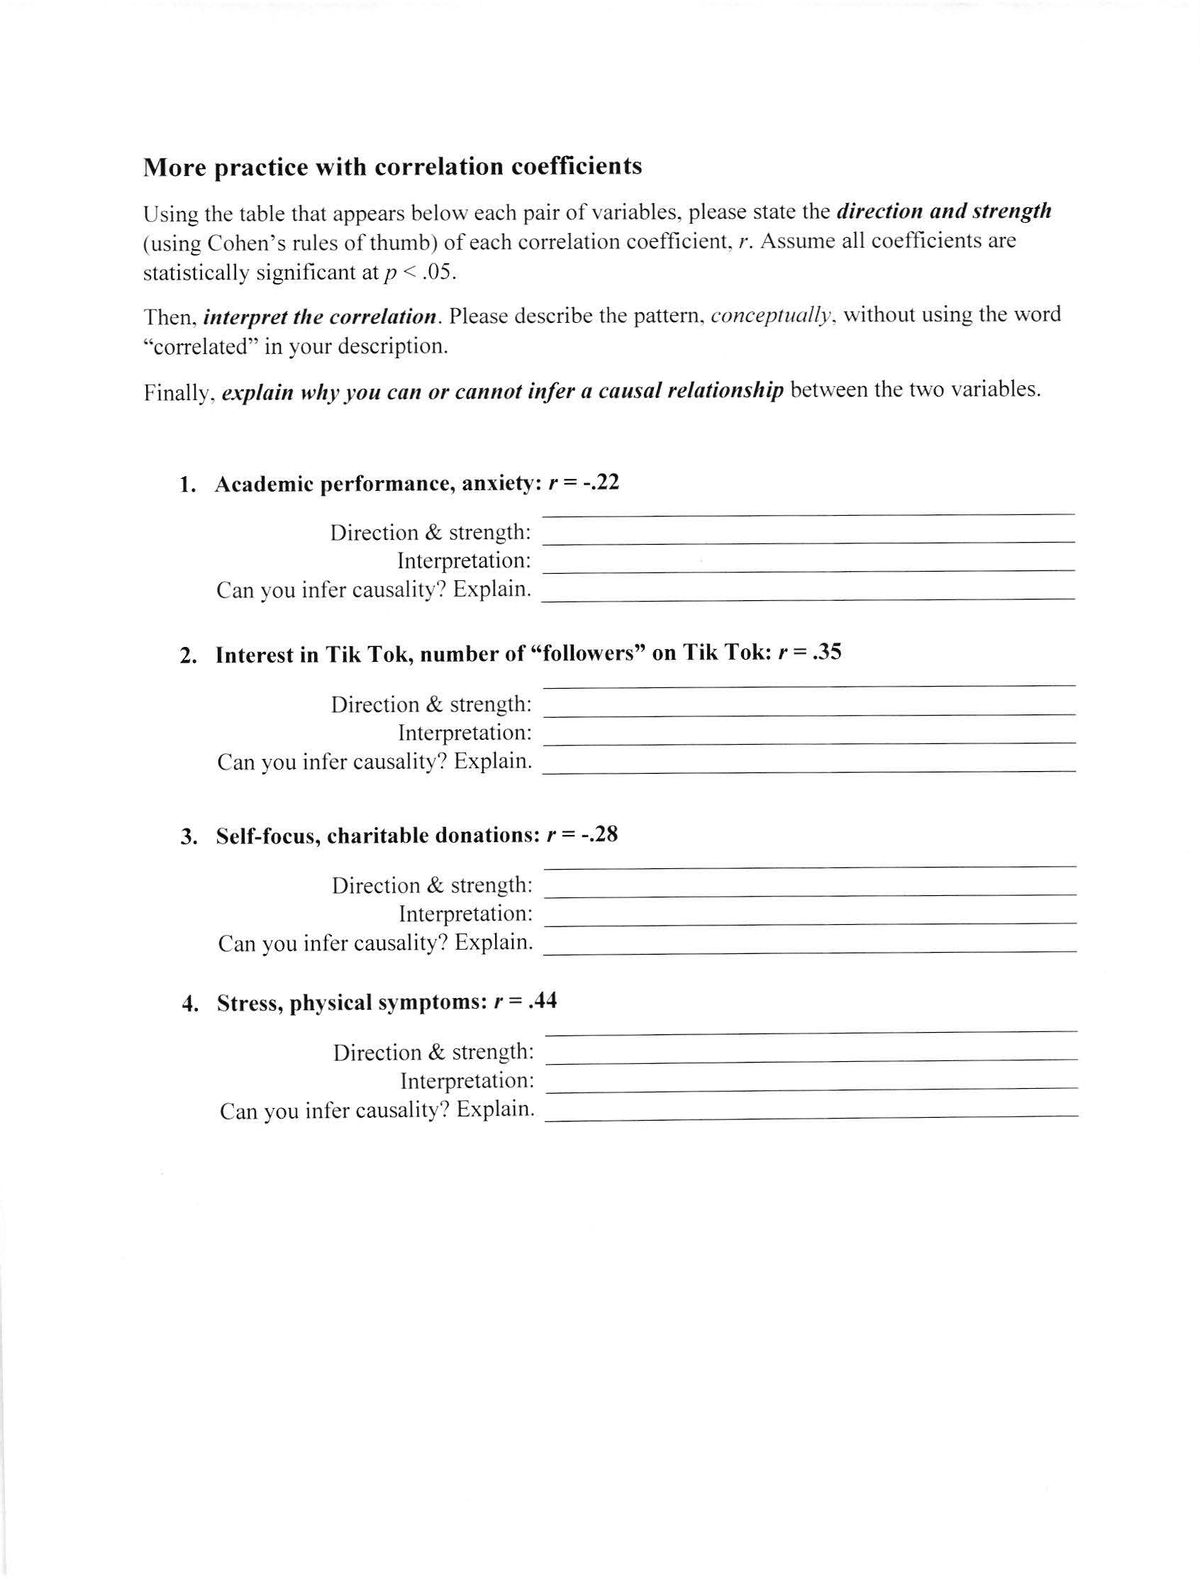
**More practice with correlation coefficients**
Using the table that appears below each pair of variables, please state the *direction and strength* (using Cohen’s rules of thumb) of each correlation coefficient, *r*. Assume all coefficients are statistically significant at *p < .05*.
Then, *interpret the correlation*. Please describe the pattern, *conceptually*, without using the word “correlated” in your description.
Finally, *explain why you can or cannot infer a causal relationship* between the two variables.
1. **Academic performance, anxiety: r = -.22**
- Direction & strength:
- Interpretation:
- Can you infer causality? Explain:
2. **Interest in Tik Tok, number of “followers” on Tik Tok: r = .35**
- Direction & strength:
- Interpretation:
- Can you infer causality? Explain:
3. **Self-focus, charitable donations: r = -.28**
- Direction & strength:
- Interpretation:
- Can you infer causality? Explain:
4. **Stress, physical symptoms: r = .44**
- Direction & strength:
- Interpretation:
- Can you infer causality? Explain:
---
This transcription provides a structured format for exploring the concept of correlation coefficients, inviting learners to analyze the relationships between different variables.
Expert Solution
This question has been solved!
Explore an expertly crafted, step-by-step solution for a thorough understanding of key concepts.

This is a popular solution

Trending nowThis is a popular solution!

Step by stepSolved in 2 steps with 1 images

Knowledge Booster

Similar questions
- Please explainarrow_forwardDescribe the range of values for the correlation coefficient.arrow_forwardPractice with correlation coefficients Using the table that appears below each pair of variables, please state the direction and strength (using Cohen’s rules of thumb) of each correlation coefficient, r. Assume all coefficients are statistically significant at p < .05. Then, interpret the correlation. Please describe the pattern, conceptually, without using the word “correlated” in your description. 3. Self-focus, charitable donations: r = -.28Direction & strength: _________________________________________________Interpretation: ________________________________________________________Can you infer causality? Explain. _______________________________________ 4. Stress, physical symptoms: r = .44Direction & strength: ____________________________________________________Interpretation: ___________________________________________________________Can you infer causality? Explain. _________________________________________arrow_forward
- use the sample data to construct a scatterplot. Use the first variable for the x-axis. Based on the scatterplot, what do you conclude about a linear correlation? FORECAST AND ACTUAL TEMPERATURES The table lists actual high temperatures and the high temperatures that were previously forecasted for these same days. The table includes data for ten different days near the author’s home. What does the result suggest about the accuracy of five-day predicted high temperatures?arrow_forwardPlease use the values from the given r values and assign the accurate value to the plots A,B,C, or D.arrow_forwardA correlation of 0.5. The community of having a cat and dog average is 60% and SD = 15. find the score of people having cats that show 75%.arrow_forward
- Which scatter plot shown has the strongest negative correlation?arrow_forwardPlease round all answers to 2 decimal places. Given the table below, use your calculator to find the Correlation Coefficient 3.9 4.6 1.7 8.3 3.5 10.8 10.7 6. 11 24.3 10.2 Put your answer here: Question Help: Video Message instructor Submit Question Cearrow_forwardWhich r is the strongest correlation? O -0.8 O-0.18 O-0.09 O 0.711 O 0.4arrow_forward
- Assume that you have paired values consisting of heights (in inches) and weights (in lb) from 40 randomly selected men. The linear correlation coefficient r is 0.567. Find the value of the coefficient of determination. What practical information does the coefficient of determination provide? Question content area bottom Part 1 Choose the correct answer below. A. The coefficient of determination is 0.321. 32.1% of the variation is explained by the linear correlation, and 67.9% is explained by other factors. B. The coefficient of determination is 0.679. 67.9% of the variation is explained by the linear correlation, and 32.1% is explained by other factors. C. The coefficient of determination is 0.321. 67.9% of the variation is explained by the linear correlation, and 32.1% is explained by other factors. D. The coefficient of determination is 0.679. 32.1% of the variation is explained by the linear correlation, and 67.9% is…arrow_forwardBased on the scatterplot, what is the most likely value of the linear correlation coefficient r?A. 0B. 1C. -1D. -0.5arrow_forwardSolve all parts , second photo is the graph that was requested.arrow_forward
arrow_back_ios
SEE MORE QUESTIONS
arrow_forward_ios
Recommended textbooks for you
- MATLAB: An Introduction with ApplicationsStatisticsISBN:9781119256830Author:Amos GilatPublisher:John Wiley & Sons Inc
 Probability and Statistics for Engineering and th...StatisticsISBN:9781305251809Author:Jay L. DevorePublisher:Cengage Learning
 Statistics for The Behavioral Sciences (MindTap C...StatisticsISBN:9781305504912Author:Frederick J Gravetter, Larry B. WallnauPublisher:Cengage Learning
  Elementary Statistics: Picturing the World (7th E...StatisticsISBN:9780134683416Author:Ron Larson, Betsy FarberPublisher:PEARSON
 The Basic Practice of StatisticsStatisticsISBN:9781319042578Author:David S. Moore, William I. Notz, Michael A. FlignerPublisher:W. H. Freeman
 Introduction to the Practice of StatisticsStatisticsISBN:9781319013387Author:David S. Moore, George P. McCabe, Bruce A. CraigPublisher:W. H. Freeman
MATLAB: An Introduction with Applications
Statistics
ISBN:9781119256830
Author:Amos Gilat
Publisher:John Wiley & Sons Inc
Probability and Statistics for Engineering and th...
Statistics
ISBN:9781305251809
Author:Jay L. Devore
Publisher:Cengage Learning
Statistics for The Behavioral Sciences (MindTap C...
Statistics
ISBN:9781305504912
Author:Frederick J Gravetter, Larry B. Wallnau
Publisher:Cengage Learning
Elementary Statistics: Picturing the World (7th E...
Statistics
ISBN:9780134683416
Author:Ron Larson, Betsy Farber
Publisher:PEARSON
The Basic Practice of Statistics
Statistics
ISBN:9781319042578
Author:David S. Moore, William I. Notz, Michael A. Fligner
Publisher:W. H. Freeman
Introduction to the Practice of Statistics
Statistics
ISBN:9781319013387
Author:David S. Moore, George P. McCabe, Bruce A. Craig
Publisher:W. H. Freeman