Normal calibration curves are generally run in water (pure solvent). If there is something in your unknown sample "matrix" which affects the analytical signal, you'll report an incorrect concentration. In this situation you'll choose to run a "standard addition" calibration curve. Standard addition entails adding the same amount of unknown to each of your standard solutions prior to analysis. This transforms your independent variable from "concentration" to "added concentration". These leads to an entirely different calculation for your unknown concentration. A standard addition procedure can be used with any analytical method. In this problem we're conducting a fluorescence assay for a blood protein which is a cancer marker. For the following problem plot a standard addition curve from the data shown below, and calculate the concentration for your unknown. Your unknown number is: 770 Solution 1 is your unknown diluted 25:1 and has an intensity of 5.94 Solution 2 is your unknown diluted 25:1 plus 25 ng/mL of standard and has an intensity of 9.09 Solution 3 is your unknown diluted 25:1 plus 50 ng/mL of standard and has an intensity of 12.22 Solution 4 is your unknown diluted 25:1 plus 75 ng/mL of standard and has an intensity of 15.15 Solution 5 is your unknown diluted 25:1 plus 100 ng/mL of standard and has an intensity of 18.44 Use a spreadsheet to produce a standard addition calibration curve graph with a linear least square calculation of the best fit line. Calculate the following in CLEARLY LABELLED cells in your spreadsheet. The slope = The intercept = The R2 value = The fluorescent marker concentration of the unknown you were given at the start of the experiment = ng/mL
Normal calibration curves are generally run in water (pure solvent). If there is something in your unknown sample "matrix" which affects the analytical signal, you'll report an incorrect concentration. In this situation you'll choose to run a "standard addition" calibration curve. Standard addition entails adding the same amount of unknown to each of your standard solutions prior to analysis. This transforms your independent variable from "concentration" to "added concentration". These leads to an entirely different calculation for your unknown concentration. A standard addition procedure can be used with any analytical method. In this problem we're conducting a fluorescence assay for a blood protein which is a cancer marker. For the following problem plot a standard addition curve from the data shown below, and calculate the concentration for your unknown. Your unknown number is: 770 Solution 1 is your unknown diluted 25:1 and has an intensity of 5.94 Solution 2 is your unknown diluted 25:1 plus 25 ng/mL of standard and has an intensity of 9.09 Solution 3 is your unknown diluted 25:1 plus 50 ng/mL of standard and has an intensity of 12.22 Solution 4 is your unknown diluted 25:1 plus 75 ng/mL of standard and has an intensity of 15.15 Solution 5 is your unknown diluted 25:1 plus 100 ng/mL of standard and has an intensity of 18.44 Use a spreadsheet to produce a standard addition calibration curve graph with a linear least square calculation of the best fit line. Calculate the following in CLEARLY LABELLED cells in your spreadsheet. The slope = The intercept = The R2 value = The fluorescent marker concentration of the unknown you were given at the start of the experiment = ng/mL

Chapter4: Least-squares And Calibration Methods
Section: Chapter Questions
Problem 10P

Related questions
Question
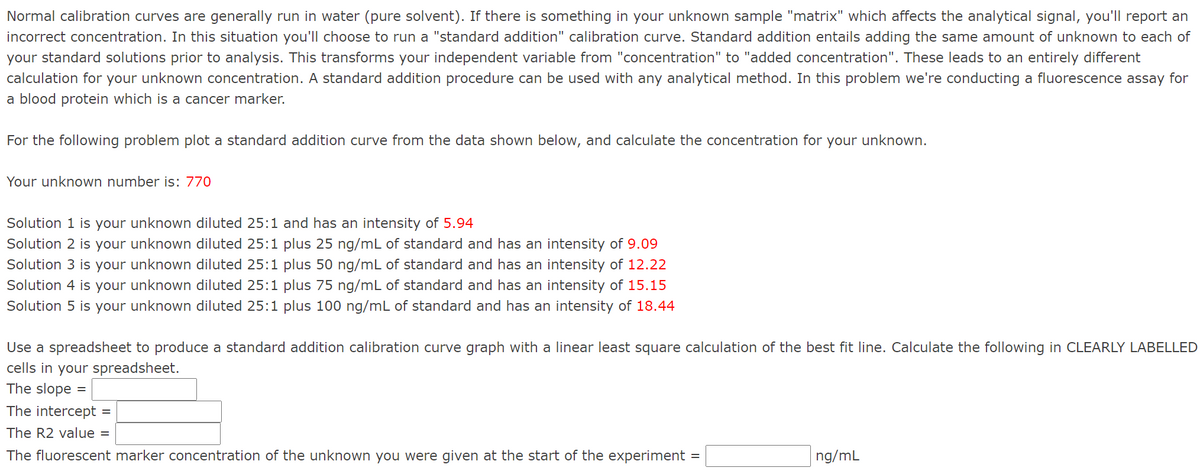
Transcribed Image Text:Normal calibration curves are generally run in water (pure solvent). If there is something in your unknown sample "matrix" which affects the analytical signal, you'll report an
incorrect concentration. In this situation you'll choose to run a "standard addition" calibration curve. Standard addition entails adding the same amount of unknown to each of
your standard solutions prior to analysis. This transforms your independent variable from "concentration" to "added concentration". These leads to an entirely different
calculation for your unknown concentration. A standard addition procedure can be used with any analytical method. In this problem we're conducting a fluorescence assay for
a blood protein which is a cancer marker.
For the following problem plot a standard addition curve from the data shown below, and calculate the concentration for your unknown.
Your unknown number is: 770
Solution 1 is your unknown diluted 25:1 and has an intensity of 5.94
Solution 2 is your unknown diluted 25:1 plus 25 ng/mL of standard and has an intensity of 9.09
Solution 3 is your unknown diluted 25:1 plus 50 ng/mL of standard and has an intensity of 12.22
Solution 4 is your unknown diluted 25:1 plus 75 ng/mL of standard and has an intensity of 15.15
Solution 5 is your unknown diluted 25:1 plus 100 ng/mL of standard and has an intensity of 18.44
Use a spreadsheet to produce a standard addition calibration curve graph with a linear least square calculation of the best fit line. Calculate the following in CLEARLY LABELLED
cells in your spreadsheet.
The slope
%D
The intercept =
The R2 value =
The fluorescent marker concentration of the unknown you were given at the start of the experiment
ng/mL
Expert Solution
This question has been solved!
Explore an expertly crafted, step-by-step solution for a thorough understanding of key concepts.

This is a popular solution!

Trending now
This is a popular solution!

Step by step
Solved in 4 steps with 1 images

Knowledge Booster


Learn more about
Need a deep-dive on the concept behind this application? Look no further. Learn more about this topic, chemistry and related others by exploring similar questions and additional content below.Recommended textbooks for you

Principles of Instrumental Analysis
Chemistry
ISBN:
9781305577213
Author:
Douglas A. Skoog, F. James Holler, Stanley R. Crouch
Publisher:
Cengage Learning

EBK A SMALL SCALE APPROACH TO ORGANIC L
Chemistry
ISBN:
9781305446021
Author:
Lampman
Publisher:
CENGAGE LEARNING - CONSIGNMENT
Principles of Instrumental Analysis
Chemistry
ISBN:
9781305577213
Author:
Douglas A. Skoog, F. James Holler, Stanley R. Crouch
Publisher:
Cengage Learning
EBK A SMALL SCALE APPROACH TO ORGANIC L
Chemistry
ISBN:
9781305446021
Author:
Lampman
Publisher:
CENGAGE LEARNING - CONSIGNMENT