On the following graph, use the green point (triangle symbol) to plot the annual total revenue when the market price is $40, $60, $80, $100, $120, $140, and $160 per bike. 6250 5820 Total Revenue 5390 4960 4530 4100 3670 3240 2810 2380 20 40 60 80 100 120 140 160 180 200 220 240 PRICE (Dollars per bike) According to the midpoint method, the price elasticity of demand between points A and B is approximately v Suppose the price of bikes is currently $80 per bike, shown as point A on the initial graph. Because the demand between points A and B is a $20-per-bike decrease in price will lead to in total revenue per day. In general, in order for a price increase to cause an increase in total revenue, demand must be TOTAL REVENUE (Dollars)
On the following graph, use the green point (triangle symbol) to plot the annual total revenue when the market price is $40, $60, $80, $100, $120, $140, and $160 per bike. 6250 5820 Total Revenue 5390 4960 4530 4100 3670 3240 2810 2380 20 40 60 80 100 120 140 160 180 200 220 240 PRICE (Dollars per bike) According to the midpoint method, the price elasticity of demand between points A and B is approximately v Suppose the price of bikes is currently $80 per bike, shown as point A on the initial graph. Because the demand between points A and B is a $20-per-bike decrease in price will lead to in total revenue per day. In general, in order for a price increase to cause an increase in total revenue, demand must be TOTAL REVENUE (Dollars)

Chapter1: Making Economics Decisions
Section: Chapter Questions
Problem 1QTC

Related questions
Question
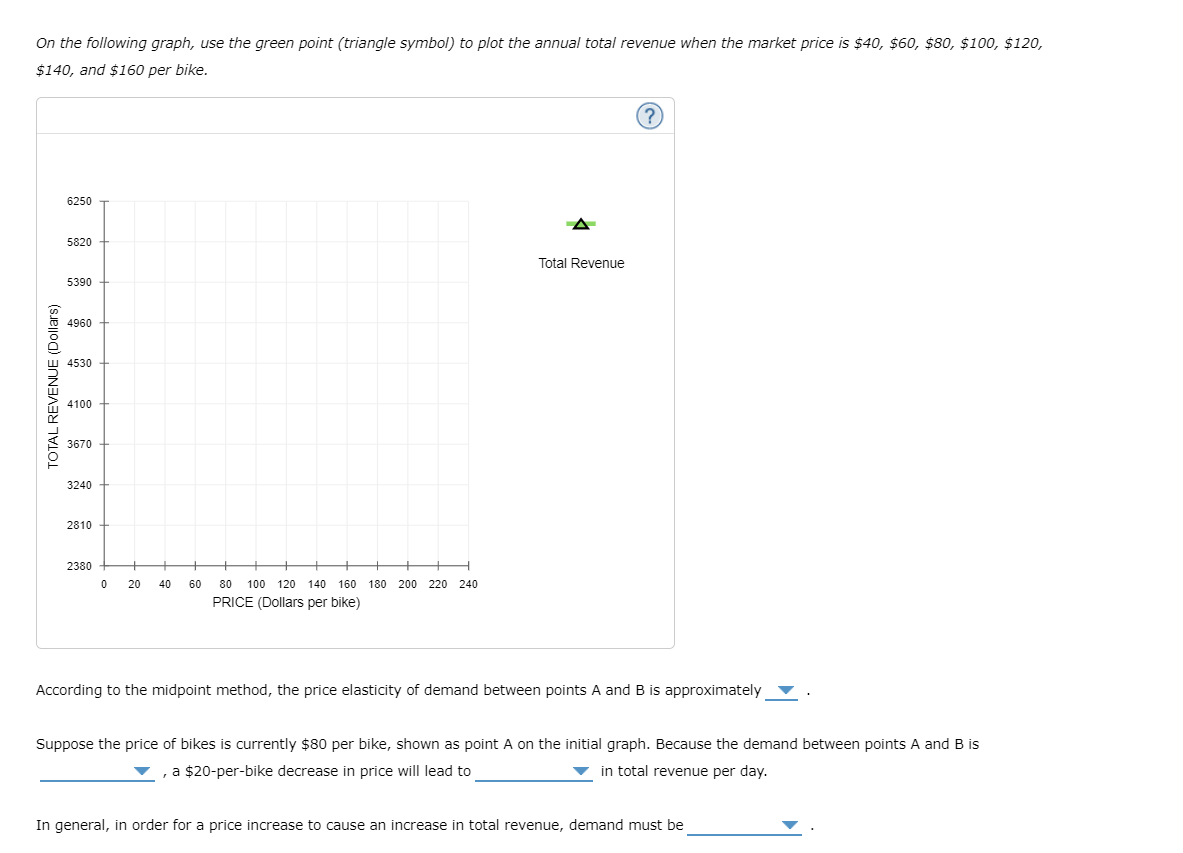
Transcribed Image Text:On the following graph, use the green point (triangle symbol) to plot the annual total revenue when the market price is $40, $60, $80, $100, $120,
$140, and $160 per bike.
6250
5820
Total Revenue
5390
4960
4530
4100
3670
3240
2810
2380
20
40
60
80
100 120 140
160 180 200 220 240
PRICE (Dollars per bike)
According to the midpoint method, the price elasticity of demand between points A and B is approximately
Suppose the price of bikes is currently $80 per bike, shown as point A on the initial graph. Because the demand between points A and B is
, a $20-per-bike decrease in price will lead to
in total revenue per day.
In general, in order for a price increase to cause an increase in total revenue, demand must be
TOTAL REVENUE (Dollars)
Expert Solution
This question has been solved!
Explore an expertly crafted, step-by-step solution for a thorough understanding of key concepts.

This is a popular solution!

Trending now
This is a popular solution!

Step by step
Solved in 2 steps

Knowledge Booster


Learn more about
Need a deep-dive on the concept behind this application? Look no further. Learn more about this topic, economics and related others by exploring similar questions and additional content below.Recommended textbooks for you

Principles of Economics (12th Edition)
Economics
ISBN:
9780134078779
Author:
Karl E. Case, Ray C. Fair, Sharon E. Oster
Publisher:
PEARSON

Engineering Economy (17th Edition)
Economics
ISBN:
9780134870069
Author:
William G. Sullivan, Elin M. Wicks, C. Patrick Koelling
Publisher:
PEARSON
Principles of Economics (12th Edition)
Economics
ISBN:
9780134078779
Author:
Karl E. Case, Ray C. Fair, Sharon E. Oster
Publisher:
PEARSON
Engineering Economy (17th Edition)
Economics
ISBN:
9780134870069
Author:
William G. Sullivan, Elin M. Wicks, C. Patrick Koelling
Publisher:
PEARSON

Principles of Economics (MindTap Course List)
Economics
ISBN:
9781305585126
Author:
N. Gregory Mankiw
Publisher:
Cengage Learning

Managerial Economics: A Problem Solving Approach
Economics
ISBN:
9781337106665
Author:
Luke M. Froeb, Brian T. McCann, Michael R. Ward, Mike Shor
Publisher:
Cengage Learning

Managerial Economics & Business Strategy (Mcgraw-…
Economics
ISBN:
9781259290619
Author:
Michael Baye, Jeff Prince
Publisher:
McGraw-Hill Education