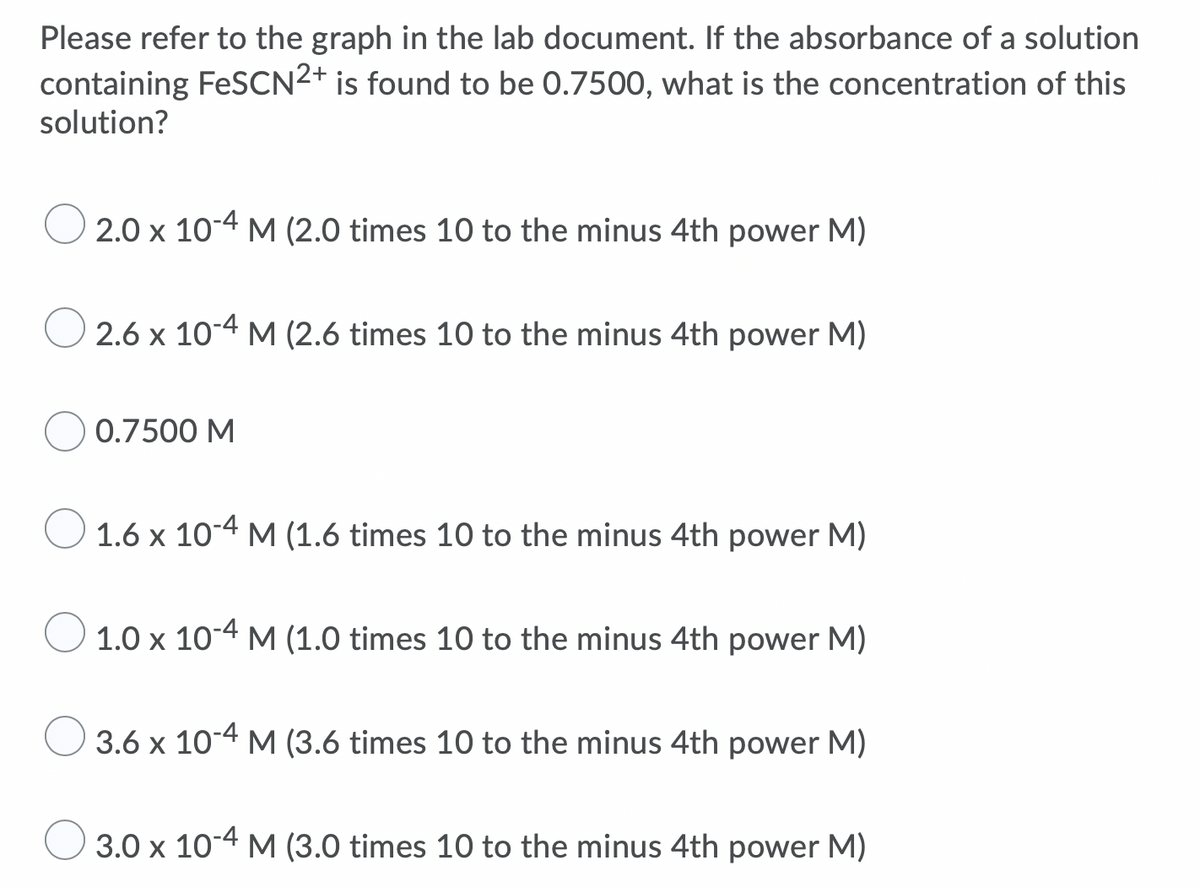
Please refer to the graph in the lab document. If the absorbance of a solution containing FeSCN2+ is found to be 0.7500, what is the concentration of this solution? O 2.0 x 10⁻⁴ M (2.0 times 10 to the minus 4th power M) O 2.6 x 10⁻⁴ M (2.6 times 10 to the minus 4th power M) 0.7500 M O 1.6 x 10⁻⁴ M (1.6 times 10 to the minus 4th power M) O 1.0 x 10⁻⁴ M (1.0 times 10 to the minus 4th power M) O 3.6 x 10⁻⁴ M (3.6 times 10 to the minus 4th power M) 10-4 M (3.0 times 10 to the minus 4th power M) О 3.0 х
Please refer to the graph in the lab document. If the absorbance of a solution containing FeSCN2+ is found to be 0.7500, what is the concentration of this solution? O 2.0 x 10⁻⁴ M (2.0 times 10 to the minus 4th power M) O 2.6 x 10⁻⁴ M (2.6 times 10 to the minus 4th power M) 0.7500 M O 1.6 x 10⁻⁴ M (1.6 times 10 to the minus 4th power M) O 1.0 x 10⁻⁴ M (1.0 times 10 to the minus 4th power M) O 3.6 x 10⁻⁴ M (3.6 times 10 to the minus 4th power M) 10-4 M (3.0 times 10 to the minus 4th power M) О 3.0 х

Chemistry & Chemical Reactivity
9th Edition
ISBN:9781133949640
Author:John C. Kotz, Paul M. Treichel, John Townsend, David Treichel
Publisher:John C. Kotz, Paul M. Treichel, John Townsend, David Treichel
Chapter4: Stoichiometry: Quantitative Information About Chemical Reactions
Section4.8: Stoichiometry Of Reactions In Aqueous Solution-titrations
Problem 2RC

Related questions
Question
Transcribed Image Text:Please refer to the graph in the lab document. If the absorbance of a solution
containing FeSCN2+ is found to be 0.7500, what is the concentration of this
solution?
O 2.0 x 10⁻⁴M (2.0 times 10 to the minus 4th power M)
2.6 x 10⁻⁴ M (2.6 times 10 to the minus 4th power M)
0.7500 M
O 1.6 x 10⁻⁴ M (1.6 times 10 to the minus 4th power M)
1.0 x 10⁻⁴ M (1.0 times 10 to the minus 4th power M)
O 3.6 x 10⁻⁴M (3.6 times 10 to the minus 4th power M)
3.0 x 10⁻⁴ M (3.0 times 10 to the minus 4th power M)
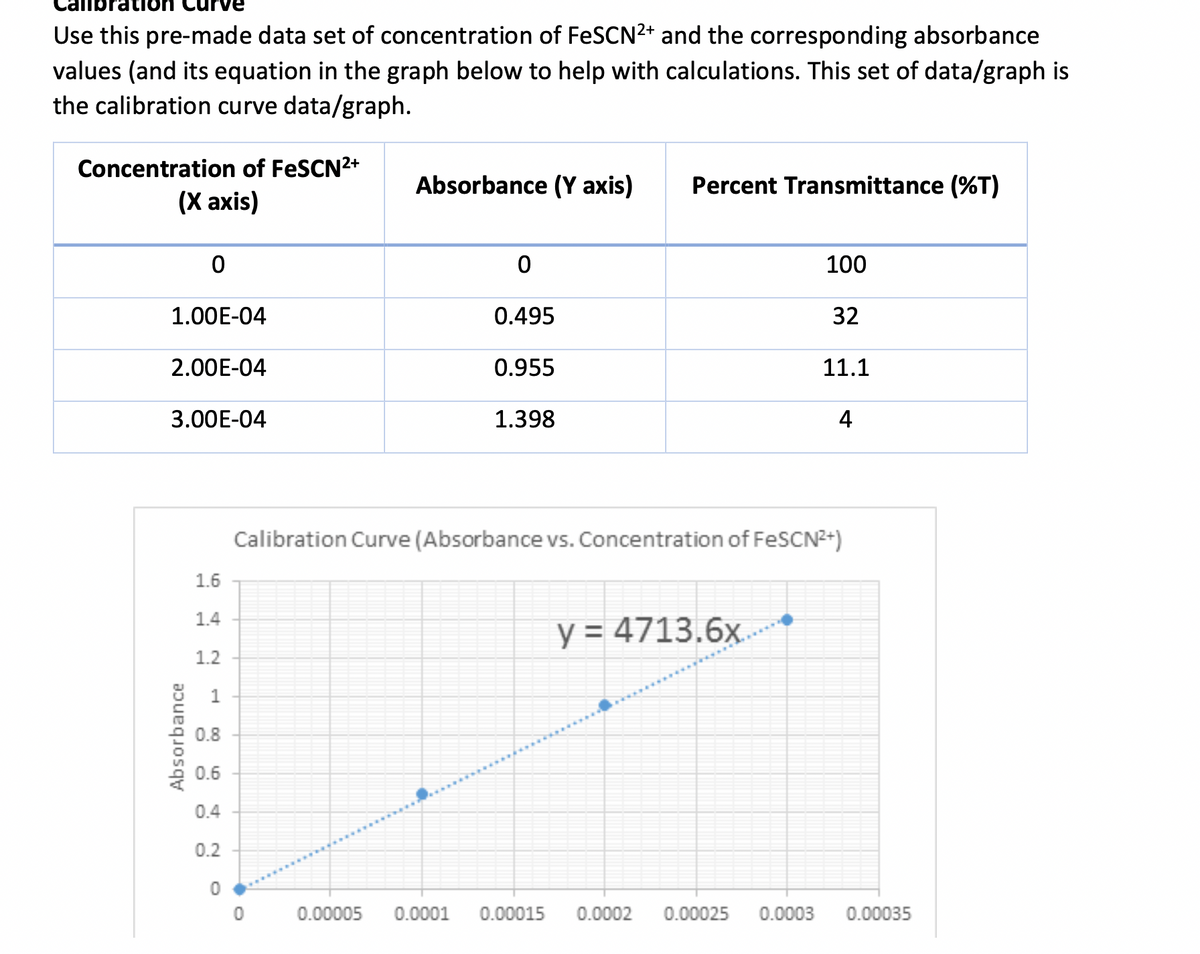
Transcribed Image Text:Use this pre-made data set of concentration of FeSCN2+ and the corresponding absorbance
values (and its equation in the graph below to help with calculations. This set of data/graph is
the calibration curve data/graph.
Concentration of FeSCN2+
Absorbance (Y axis)
Percent Transmittance (%T)
(Х аxis)
100
1.00E-04
0.495
32
2.00E-04
0.955
11.1
3.00E-04
1.398
4
Calibration Curve (Absorbance vs. Concentration of FESCN2+)
1.6
1.4
y = 4713.6x
1.2
1
0.8
0.6
0.4
0.2
0.00005
0.0001
0.00015
0.0002
0.00025
0.0003
0.00035
Absorbance
Expert Solution
This question has been solved!
Explore an expertly crafted, step-by-step solution for a thorough understanding of key concepts.

Step by step
Solved in 3 steps with 1 images

Knowledge Booster


Learn more about
Need a deep-dive on the concept behind this application? Look no further. Learn more about this topic, chemistry and related others by exploring similar questions and additional content below.Recommended textbooks for you
Chemistry & Chemical Reactivity
Chemistry
ISBN:
9781133949640
Author:
John C. Kotz, Paul M. Treichel, John Townsend, David Treichel
Publisher:
Cengage Learning
Chemistry & Chemical Reactivity
Chemistry
ISBN:
9781133949640
Author:
John C. Kotz, Paul M. Treichel, John Townsend, David Treichel
Publisher:
Cengage Learning