
MATLAB: An Introduction with Applications
6th Edition
ISBN: 9781119256830
Author: Amos Gilat
Publisher: John Wiley & Sons Inc
expand_more
expand_more
format_list_bulleted
Related questions
Question
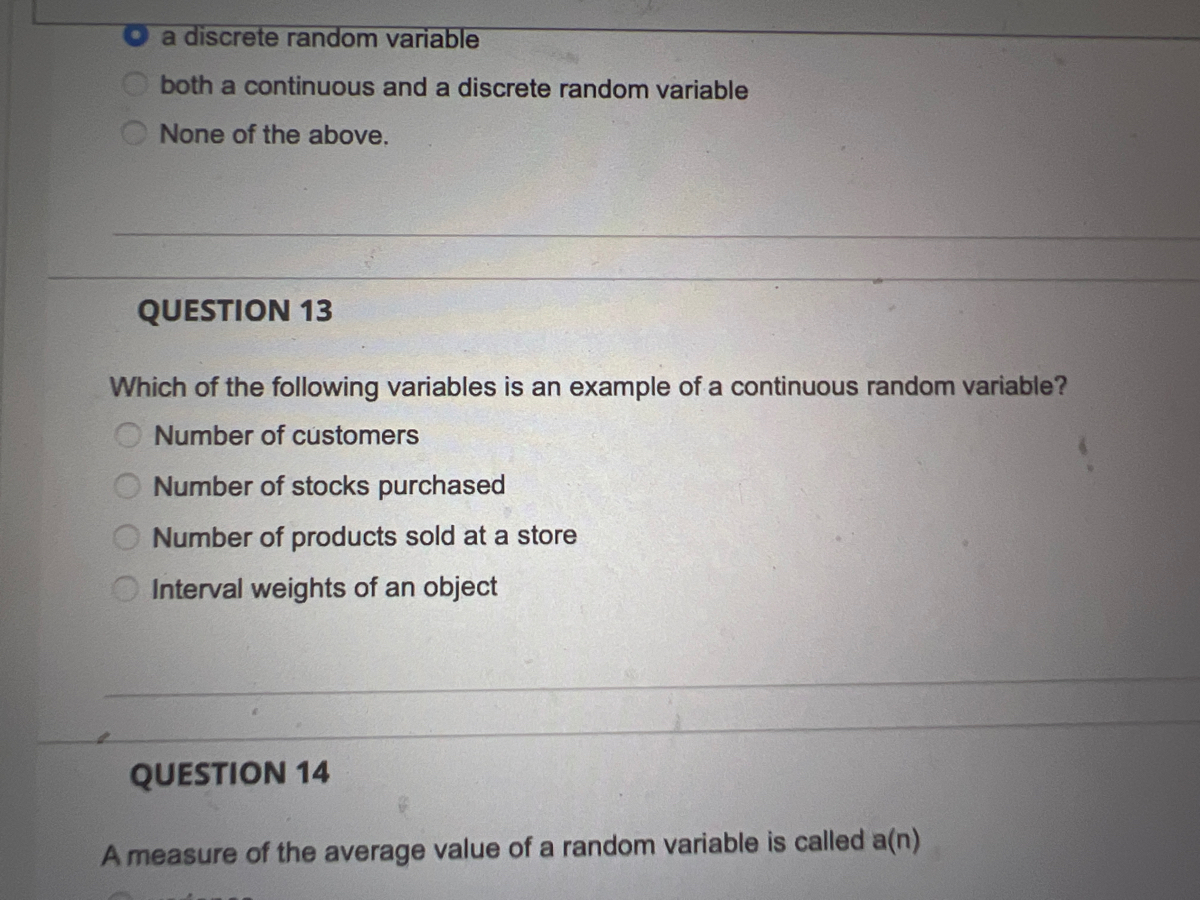

Transcribed Image Text:a discrete random variable
both a continuous and a discrete random variable
None of the above.
QUESTION 13
Which of the following variables is an example of a continuous random variable?
Number of customers
Number of stocks purchased
Number of products sold at a store
Interval weights of an object
QUESTION 14
A measure of the average value of a random variable is called a(n)
Expert Solution
This question has been solved!
Explore an expertly crafted, step-by-step solution for a thorough understanding of key concepts.

This is a popular solution

Trending nowThis is a popular solution!

Step by stepSolved in 2 steps

Knowledge Booster

Similar questions
- Suppose X and Y are uncorrelated random variables. Which of the following statements are true? Group of answer choices: the sample correlation for 10 data points sampled from the joint distribution of X and Y will be exactly 0. X and Y have no relationship X and Y are independent X and Y have no linear relationshiparrow_forwardWhen data is said to be binomial, this means that ___________. a. They will always be normally distributed b. There are only 2 sets of data c. There are only 2 categories in which a measurement could possibly belong d. The data is classified into 2 or more categoriesarrow_forwardScore: 0 of 1 pt Question Hel 4.2.12 Use the data in the following table, which lists drive-thru order accuracy at popular fast food chains. Assume that orders are randomly selected from those included in the table. Drive-thru Restaurant o A 315 261 237 122 Order Accurate Order Not Accurate 32 53 38 11 If one order is selected, find the probability of getting an order that is not accurate or is from Restaurant C. Are the evehts of selecting an order that is not accurate and selecting an order from Restaurant C disjoint events? The probability of getting an order from Restaurant C or an order that is not accurate is (Round to three decimal places as needed.) Enter your answer in the answer box and then click Check Answer. 1 part remaining Clear ll Cleck Answer 1:30 to search 86°F Sunny 6/27/ F2 F3 F4 F5 F6 PrtSc Insert F7 F8 F9 F10 F11 F12 4. 7 23 团arrow_forward
- The chance of an IRS audit for a tax return with over $25,000 in income is about 2% per year. We are interested in the expected number of audits a person with that income has in a 16-year period. Assume each year is independent. Part (a) Part (b) List the values that X may take on. X=0, 1, 2,..., 15, 16 OX= 1, 2, 3, OX= 1, 2, 3, OX=1,2,3,... 15, 16 98, 99, 100 Part (c) Give the distribution of X X-B 0.02 □ Part (d) How many audits are expected in a 16-year period? (Round your answer to two decimal places.) 0.32 audits Part (e) Find the probability that a person is not audited at all. (Round your answer to four decimal places.) Part (1) Find the probability that a person is audited more than twice. (Round your answer to four decimal places.)arrow_forwardGive an explanation why this statement is either true or false: Portfolio contains n assets. Therefore, portfolio variance for this portfolio is the function of 2n covariances and n variances.arrow_forward#7arrow_forward
- MANUFACTURING PRODUCTIVITY You are an Operations Manager for a local steel manufacturing company, and you are in the process of selecting a vendor for a new type of metal finishing machine. For the past week you’ve tested machines from three different companies and collected the randomly sampled data below that shows how many parts each machine produced in seven different one-hour periods over the course of your manufacturing test. Is the average production of these machines the same, or is one of them different from the others? [If the productivity is the same, you will simply choose the machine with the lowest cost.] You may assume that all populations are independent and nearly normal. Test at the 95% confidence level. (i.e. α= 0.05) Parts produced per hour for machines from three vendors: Machine A Machine B Machine C 112 116 102 104 118 107 116 112 108 98 108 92 109 113 114 111 117 105 115 107 102 What…arrow_forwardDo bonds reduce the overall risk of an investment portfolio? Let x be a random variable representing annual percent return for Vanguard Total Stock Index (all stocks). Let y be a random variable representing annual return for Vanguard Balanced Index (60% stock and 40% bond). For the past several years, we have the following data. x: 15 0 24 28 15 17 36 −9 −16 −16 y: 21 −8 27 10 10 27 22 −2 −3 −1arrow_forwardX Question 13 Let X be a continuous random variable. Let's denote the p-th percentile of X as p%. For what value a, 160% = IQ? α = 0.60 X (Round the answer to 2 decimal places)arrow_forward
arrow_back_ios
arrow_forward_ios
Recommended textbooks for you
- MATLAB: An Introduction with ApplicationsStatisticsISBN:9781119256830Author:Amos GilatPublisher:John Wiley & Sons Inc
 Probability and Statistics for Engineering and th...StatisticsISBN:9781305251809Author:Jay L. DevorePublisher:Cengage Learning
 Statistics for The Behavioral Sciences (MindTap C...StatisticsISBN:9781305504912Author:Frederick J Gravetter, Larry B. WallnauPublisher:Cengage Learning
  Elementary Statistics: Picturing the World (7th E...StatisticsISBN:9780134683416Author:Ron Larson, Betsy FarberPublisher:PEARSON
 The Basic Practice of StatisticsStatisticsISBN:9781319042578Author:David S. Moore, William I. Notz, Michael A. FlignerPublisher:W. H. Freeman
 Introduction to the Practice of StatisticsStatisticsISBN:9781319013387Author:David S. Moore, George P. McCabe, Bruce A. CraigPublisher:W. H. Freeman
MATLAB: An Introduction with Applications
Statistics
ISBN:9781119256830
Author:Amos Gilat
Publisher:John Wiley & Sons Inc
Probability and Statistics for Engineering and th...
Statistics
ISBN:9781305251809
Author:Jay L. Devore
Publisher:Cengage Learning
Statistics for The Behavioral Sciences (MindTap C...
Statistics
ISBN:9781305504912
Author:Frederick J Gravetter, Larry B. Wallnau
Publisher:Cengage Learning
Elementary Statistics: Picturing the World (7th E...
Statistics
ISBN:9780134683416
Author:Ron Larson, Betsy Farber
Publisher:PEARSON
The Basic Practice of Statistics
Statistics
ISBN:9781319042578
Author:David S. Moore, William I. Notz, Michael A. Fligner
Publisher:W. H. Freeman
Introduction to the Practice of Statistics
Statistics
ISBN:9781319013387
Author:David S. Moore, George P. McCabe, Bruce A. Craig
Publisher:W. H. Freeman