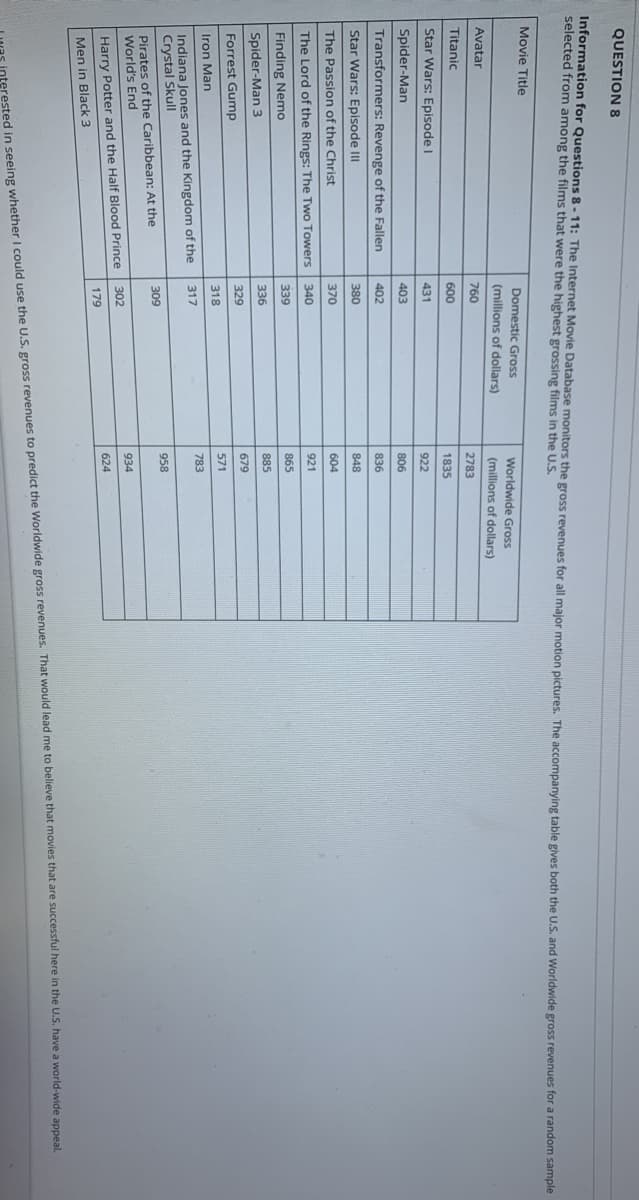
QUESTION 8 Information for Questions 8-11: The Internet Movie Database monitors the eross revenues for all maior motion pictures, The accompanying table gives both the U.S. and Worldwide gross revenues for a random sample selected from among the films that were the highest grossing films in the U.S. Movie Title Domestic Gross Worldwide Gross (millions of dollars) (millions of dollars) Avatar 760 2783 Titanic 600 1835 Star Wars: Episode i 431 922 Spider-Man 403 806 Transformers: Revenge of the Fallen 402 836 Star Wars: Episode III 380 848 The Passion of the Christ 370 604 The Lord of the Rings: The Two Towers 340 921 Finding Nemo 339 865 Spider-Man 3 336 885 329 679 Forrest Gump 571 318 Iron Man 783 Indiana Jones and the Kingdom of the Crystal Skull 317 958 Pirates of the Caribbean: At the World's End 309 934 302 Harry Potter and the Half Blood Prince 624 179 Men in Black 3 gross revenues. That would lead me to believe that movies that are successful here in the U.S. have a world-wide appeal

Functions and Change: A Modeling Approach to College Algebra (MindTap Course List)
6th Edition
ISBN:9781337111348
Author:Bruce Crauder, Benny Evans, Alan Noell
Publisher:Bruce Crauder, Benny Evans, Alan Noell
Chapter5: A Survey Of Other Common Functions
Section5.3: Modeling Data With Power Functions
Problem 6E: Urban Travel Times Population of cities and driving times are related, as shown in the accompanying...
icon
Related questions
icon
Concept explainers
Topic Video
Question
Thank you so much
QUESTION 8
Information for Questions 8- 11: The Internet Movie Database monitors the gross revenues for all maior motion pictures. The accompanying table gives both the U.S. and Worldwide gross revenues for a random sample
selected from among the films that were the highest grossing films in the U.S.
Movie Title
Domestic Gros
Worldwide Gross
(millions of dollars)
Avatar
760
2783
Titanic
600
1835
Star Wars: Episode I
431
922
Spider-Man
403
Transformers: Revenge of the Fallen
402
836
Star Wars: Episode III
380
848
The Passion of the Christ
370
604
The Lord of the Rings: The Two Towers
340
921
Finding Nemo
339
865
Spider-Man 3
336
885
329
679
Forrest Gump
318
571
Iron Man
783
Indiana Jones and the Kingdom of the
Crystal Skull
317
958
Pirates of the Caribbean: At the
World's End
309
934
302
Harry Potter and the Half Blood Prince
179
Men in Black 3
interested in seeing I could use the U.S. gross to predict the gross to that here in the U.S. have a appeal.
Transcribed Image Text:QUESTION 8 Information for Questions 8- 11: The Internet Movie Database monitors the gross revenues for all maior motion pictures. The accompanying table gives both the U.S. and Worldwide gross revenues for a random sample selected from among the films that were the highest grossing films in the U.S. Movie Title Domestic Gros Worldwide Gross (millions of dollars) (millions of dollars) Avatar 760 2783 Titanic 600 1835 Star Wars: Episode I 431 922 Spider-Man 403 Transformers: Revenge of the Fallen 402 836 Star Wars: Episode III 380 848 The Passion of the Christ 370 604 The Lord of the Rings: The Two Towers 340 921 Finding Nemo 339 865 Spider-Man 3 336 885 329 679 Forrest Gump 318 571 Iron Man 783 Indiana Jones and the Kingdom of the Crystal Skull 317 958 Pirates of the Caribbean: At the World's End 309 934 302 Harry Potter and the Half Blood Prince 179 Men in Black 3 interested in seeing I could use the U.S. gross to predict the gross to that here in the U.S. have a appeal.
I was interested in seeing whether I could use the U.S. gros revenues to predict the Worldwide pross revenues, That would lead me to believe that movies that are successful here in the U.S. have a world-wide appeal.
To begin your analysis, do a scatterplot of the data and comment on the graph.
The graph shows a strong negative quadratic trend.
Ob.
Since there is a lot of scatter in the data, indicating a strong linear relationship between the 2 variables, the r-value would be close to 0 and the R-Square value would be close to 1.0.
Oc.
The graph shows a scatter of points with no pattern.
O d.
The graph shows a weak negative linear association between the variables.
O e.
The graph shows a positive linear trend but it looks like it is due mostly to two data points.
Transcribed Image Text:I was interested in seeing whether I could use the U.S. gros revenues to predict the Worldwide pross revenues, That would lead me to believe that movies that are successful here in the U.S. have a world-wide appeal. To begin your analysis, do a scatterplot of the data and comment on the graph. The graph shows a strong negative quadratic trend. Ob. Since there is a lot of scatter in the data, indicating a strong linear relationship between the 2 variables, the r-value would be close to 0 and the R-Square value would be close to 1.0. Oc. The graph shows a scatter of points with no pattern. O d. The graph shows a weak negative linear association between the variables. O e. The graph shows a positive linear trend but it looks like it is due mostly to two data points.
Expert Solution
trending now

Trending now

This is a popular solution!

steps

Step by step

Solved in 2 steps with 1 images

Blurred answer
Knowledge Booster
Application of Algebra
Learn more about
Need a deep-dive on the concept behind this application? Look no further. Learn more about this topic, statistics and related others by exploring similar questions and additional content below.
Similar questions
  • SEE MORE QUESTIONS
Recommended textbooks for you
Functions and Change: A Modeling Approach to Coll…
Algebra
ISBN:
9781337111348
Author:
Bruce Crauder, Benny Evans, Alan Noell
Publisher:
Cengage Learning
Linear Algebra: A Modern Introduction
Algebra
ISBN:
9781285463247
Author:
David Poole
Publisher:
Cengage Learning