1) Total Fixed Liabilities / LTD. 2) Current Liabilities / STD. 3) Total Liabilities.
1) Total Fixed Liabilities / LTD. 2) Current Liabilities / STD. 3) Total Liabilities.

Financial Reporting, Financial Statement Analysis and Valuation
8th Edition
ISBN:9781285190907
Author:James M. Wahlen, Stephen P. Baginski, Mark Bradshaw
Publisher:James M. Wahlen, Stephen P. Baginski, Mark Bradshaw
Chapter8: Investing Activities
Section: Chapter Questions
Problem 1.3AIC: Estimate the average total estimated useful life of depreciable property, plant, and equipment....

Related questions
Question
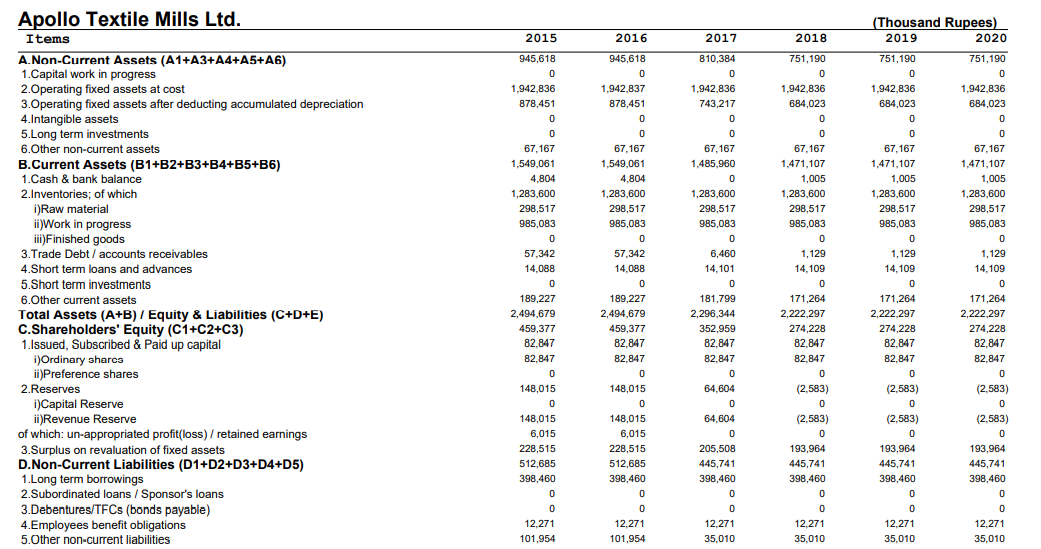
Select 2019 Year From The Given Data In Image And Find The Following thing:
1) Total Fixed Liabilities / LTD.
2) Current Liabilities / STD.
3) Total Liabilities.
4) Contractual Liabilities or Total Bank Debt.
5) Shareholders Equity (SHE) / Net worth.
6) Financial Exp as a % of Sales.
7) Balance Sheet Growth - (TOTAL ASSETS CURRENT YEAR- TOTAL ASSETS CURRENT YEAR) / TOTAL ASSETS PREVIOUS YEAR.
8) Sales.
9) PAT / NI.
10) Annual
11) Fixed Assets at Book Value.
12) Total Assets.
13) EBIT.
14) Financial Cost / Interest Expense.
Transcribed Image Text:Apollo Textile Mills Ltd.
(Thousand Rupees)
2020
Items
2015
2016
2017
2018
2019
A.Non-Current Assets (A1+A3+A4+A5+A6)
1.Capital work in progress
2.0perating fixed assets at cost
3.0perating fixed assets after deducting accumulated depreciation
4.Intangible assets
5.Long term investments
945,618
945,618
810,384
751,190
751,190
751,190
1,942,836
1,942,837
1,942,836
1,942,836
1,942,836
1,942,836
878,451
878,451
743,217
684,023
684,023
684,023
6.Other non-current assets
67,167
67,167
67, 167
67,167
67,167
67,167
B.Current Assets (B1+B2+B3+B4+B5+B6)
1.Cash & bank balance
1,549,061
1,549,061
1,485,960
1,471,107
1,471,107
1,471,107
4,804
4,804
1,005
1,005
1,005
2.Inventories; of which
i)Raw material
1,283,600
1,283,600
1,283,600
1,283,600
1,283,600
1,283,600
298,517
298,517
298,517
298,517
298,517
298,517
ii)Work in progress
iii)Finished goods
985,083
985,083
985,083
985,083
985,083
985,083
3.Trade Debt / accounts receivables
57,342
57,342
6,460
1,129
1,129
1,129
4.Short term loans and advances
5.Short term investments
6.Other current assets
Total Assets (A+B) / Equity & Liabilities (C+D+E)
C.Shareholders' Equity (C1+C2+C3)
1.lssued, Subscribed & Paid up capital
i)Ordinary sharc3
ii)Preference shares
2.Reserves
i)Capital Reserve
ii)Revenue Reserve
of which: un-appropriated profit(loss) / retained earnings
14,088
14,088
14,101
14,109
14,109
14,109
189,227
189,227
181,799
171,264
171,264
171,264
2,222,297
274,228
82,847
2,494,679
2,494,679
2,296,344
2,222,297
2,222,297
459,377
459,377
352,959
274,228
274,228
82,847
82,847
82,847
82,847
82,847
82,847
82,847
82,847
82,847
82,847
82,847
148,015
148,015
64,604
(2,583)
(2,583)
(2,583)
148,015
148,015
64,604
(2,583)
(2,583)
(2,583)
6,015
6,015
193,964
3.Surplus on revaluation of fixed assets
D.Non-Current Liabilities (D1+D2+D3+D4+D5)
1.Long term borrowings
2.Subordinated loans / Sponsor's loans
B.Debentures/TFCS (bonds payable)
4.Employees benefit obligations
228,515
228,515
205,508
193,964
193,964
512,685
512,685
445,741
445,741
445,741
445,741
398,460
398,460
398,460
398,460
398,460
398,460
12,271
12,271
12,271
12,271
12,271
12,271
5.0ther non-current liabilities
101,954
101,954
35,010
35,010
35,010
35,010
![1,502,328
E.Current Liabilities (E1+E2+E3+E4)
1.Trade credit & other accounts payables
of which: i) Trade credits
2.Short term borrowings
1,522,617
1,522,617
1,497,644
1,502,328
1,502,328
51,357
51,357
26,388
31,072
31,072
31,072
24,992
24,992
13,540
13,501
13,501
13,501
1,153,889
1,153,889
1,167,608
1,167,608
1,167,608
1,167,608
77,655
77,655
63,936
63,936
63,936
63,936
3.Current portion of non-current liabilities
4.Other current liabilities
239,716
239,716
239,712
239,712
239,712
239,712
F.Operations:
1.Sales
373
373
i)Local sales (Net)
ii)Export sales (Net)
373
373
2.Cost of sales
93,182
93,182
69,854
66,129
66,129
66, 129
i)Cost of material
3.Gross profit / (loss) (F1-F2)
4.General, administrative and other expenses
i)Selling & distribution expenses
ii)Administrative and other expenses
5.Other income / (loss)
(92,809)
11,078
(92,809)
(69,854)
(66,129)
(66, 129)
(66,129)
11,078
9,196
12,544
12,544
12,544
2
11.076
11,076
9,196
12,544
12,544
12,544
(103,887]
(79,050)
(78,673)
(78,673)
(78,673)
6.EBIT (F3-F4+F5)
7.Financial expenses
of which: (i) Interest expenses
8.Profit / (loss) before taxation (F6-F7)
9.Тах еxpenses
10.Profit / (loss) after tax (F8-F9)
11.Cash dividends
12.Bonus shares / stock dividends
(103,887)
19
19
31
59
59
59
(103,906)
(103,906)
(79,081)
(78,732)
(78,732)
(78,732)
(6,208)
(6,208)
(97,698)
(97,698)
(79,081)
(78,732)
(78,732)
(78,732)
G.Statement of Cash Flows
(3,104)
1.Net cash flows from operating activities
2.Net cash flows from investing activities
3.Net cash flows from financing activities
H.Miscellaneous
1.Total capital employed (C+D)
2.Retention in business (F10-F11-F12)
3.Depreciation for the year
4.Salaries, wages and employee benefits
I.Key Performance Indicators
P1. Net Profit margin / Net profit to sales (F10 as % of F1)
P2. Asset turnover (F1 to Avg (Current year(A+B).previous year (A+B)})
P3. Return on Assets (F10 as a % of Avg {Current year(A+B).previous year (A+B)}
P4. Financial leverage (Avg. (Current year(A+B),previous year (A+B) to Avg. Current
year(C).previous year (C)})
P5. Return on equity (F10 as % of Avg (Current year(C),previous year (C)}
V3. Basic earnings per share (Rs./share) (F10 to No. of shares)
(3,104)
1,005
1,005
1,005
1,153,889
972,062
972,062
798,700
719,969
719,969
719,969
(97,698)
(97,698)
(79,081)
(78,732)
59,194
(78,732)
59,194
(78,732)
64,640
59,194
6,290
7,371
7,371
7,371
-26,192.49
-26,192.49
0.00
0.00
0.00
0.00
0.00
0.00
-3.82
-3.92
-3.30
-3.48
-3.54
-3.54
5.03
5.43
5.90
7.20
8.10
8.10
-19.22
-21.27
-19.47
-25.11
-28.71
-28.71
-11.79
-11.79
-9.55
-9.50
-9.50
-9.50](/v2/_next/image?url=https%3A%2F%2Fcontent.bartleby.com%2Fqna-images%2Fquestion%2Fb4c5181b-7421-4f0c-a496-5abae2d13788%2F98b85659-fe98-4277-86dc-4eaf69fe04c4%2Fhgw5rm_processed.png&w=3840&q=75)
Transcribed Image Text:1,502,328
E.Current Liabilities (E1+E2+E3+E4)
1.Trade credit & other accounts payables
of which: i) Trade credits
2.Short term borrowings
1,522,617
1,522,617
1,497,644
1,502,328
1,502,328
51,357
51,357
26,388
31,072
31,072
31,072
24,992
24,992
13,540
13,501
13,501
13,501
1,153,889
1,153,889
1,167,608
1,167,608
1,167,608
1,167,608
77,655
77,655
63,936
63,936
63,936
63,936
3.Current portion of non-current liabilities
4.Other current liabilities
239,716
239,716
239,712
239,712
239,712
239,712
F.Operations:
1.Sales
373
373
i)Local sales (Net)
ii)Export sales (Net)
373
373
2.Cost of sales
93,182
93,182
69,854
66,129
66,129
66, 129
i)Cost of material
3.Gross profit / (loss) (F1-F2)
4.General, administrative and other expenses
i)Selling & distribution expenses
ii)Administrative and other expenses
5.Other income / (loss)
(92,809)
11,078
(92,809)
(69,854)
(66,129)
(66, 129)
(66,129)
11,078
9,196
12,544
12,544
12,544
2
11.076
11,076
9,196
12,544
12,544
12,544
(103,887]
(79,050)
(78,673)
(78,673)
(78,673)
6.EBIT (F3-F4+F5)
7.Financial expenses
of which: (i) Interest expenses
8.Profit / (loss) before taxation (F6-F7)
9.Тах еxpenses
10.Profit / (loss) after tax (F8-F9)
11.Cash dividends
12.Bonus shares / stock dividends
(103,887)
19
19
31
59
59
59
(103,906)
(103,906)
(79,081)
(78,732)
(78,732)
(78,732)
(6,208)
(6,208)
(97,698)
(97,698)
(79,081)
(78,732)
(78,732)
(78,732)
G.Statement of Cash Flows
(3,104)
1.Net cash flows from operating activities
2.Net cash flows from investing activities
3.Net cash flows from financing activities
H.Miscellaneous
1.Total capital employed (C+D)
2.Retention in business (F10-F11-F12)
3.Depreciation for the year
4.Salaries, wages and employee benefits
I.Key Performance Indicators
P1. Net Profit margin / Net profit to sales (F10 as % of F1)
P2. Asset turnover (F1 to Avg (Current year(A+B).previous year (A+B)})
P3. Return on Assets (F10 as a % of Avg {Current year(A+B).previous year (A+B)}
P4. Financial leverage (Avg. (Current year(A+B),previous year (A+B) to Avg. Current
year(C).previous year (C)})
P5. Return on equity (F10 as % of Avg (Current year(C),previous year (C)}
V3. Basic earnings per share (Rs./share) (F10 to No. of shares)
(3,104)
1,005
1,005
1,005
1,153,889
972,062
972,062
798,700
719,969
719,969
719,969
(97,698)
(97,698)
(79,081)
(78,732)
59,194
(78,732)
59,194
(78,732)
64,640
59,194
6,290
7,371
7,371
7,371
-26,192.49
-26,192.49
0.00
0.00
0.00
0.00
0.00
0.00
-3.82
-3.92
-3.30
-3.48
-3.54
-3.54
5.03
5.43
5.90
7.20
8.10
8.10
-19.22
-21.27
-19.47
-25.11
-28.71
-28.71
-11.79
-11.79
-9.55
-9.50
-9.50
-9.50
Expert Solution
This question has been solved!
Explore an expertly crafted, step-by-step solution for a thorough understanding of key concepts.

Step by step
Solved in 2 steps

Knowledge Booster


Learn more about
Need a deep-dive on the concept behind this application? Look no further. Learn more about this topic, accounting and related others by exploring similar questions and additional content below.Recommended textbooks for you
Financial Reporting, Financial Statement Analysis…
Finance
ISBN:
9781285190907
Author:
James M. Wahlen, Stephen P. Baginski, Mark Bradshaw
Publisher:
Cengage Learning

Principles of Accounting Volume 1
Accounting
ISBN:
9781947172685
Author:
OpenStax
Publisher:
OpenStax College
Financial Reporting, Financial Statement Analysis…
Finance
ISBN:
9781285190907
Author:
James M. Wahlen, Stephen P. Baginski, Mark Bradshaw
Publisher:
Cengage Learning
Principles of Accounting Volume 1
Accounting
ISBN:
9781947172685
Author:
OpenStax
Publisher:
OpenStax College