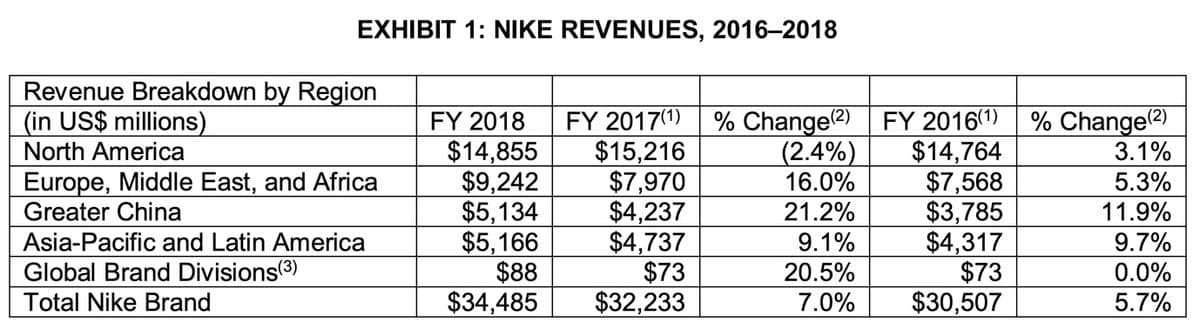
Revenue Breakdown by Region (in US$ millions) North America % Change2) FY 2016(1) $14,764 $7,568 $3,785 $4,317 $73 $30,507 % Change2) 3.1% 5.3% 11.9% FY 2018 FY 2017(1) $14,855 $9,242 $5,134 $5,166 $88 $34,485 $15,216 $7,970 $4,237 $4,737 $73 $32,233 (2.4%) 16.0% 21.2% 9.1% Europe, Middle East, and Africa Greater China 9.7% 0.0% Asia-Pacific and Latin America Global Brand Divisions(3) 20.5% 7.0% Total Nike Brand 5.7%


Q: Assume that sales revenue in 2022 changed to $755,00 and cost of goods changed to $512,000. Income…
A: Formula: Net income = Total Revenues - Total Expenses
Q: Plant
A: Answer: 3.25 times
Q: 2019 2015 2017 $ 485,044 S 319,108 $ 248.333 S 175,500 $ 135,000 122,700 16,986 2018 2016 Sales Cost…
A: Trend analysis is used to analyze the trend on the basis of the base year. The management can make…
Q: Return on Assets Ratio and Asset Turnover Ratio Northern Systems reported the following financial…
A: Return on Assets (ROA): This financial ratio evaluates a company's efficiency in operating the…
Q: All sales were on credit. Net cash provided by operating activities for 2022 was $242,000. Capital…
A: As per the honor code, we only answer up to 3 sub-parts, we’ll answer the first 3. Please resubmit…
Q: Return on Assets Ratio and Asset Turnover Ratio Northern Systems reported the following financial…
A: First, there is a need to calculate average total assets:
Q: For the year ended December 31, 2021 Sales P 6,100,0 Cost of sales 3,700,00 Gross profit Gain on…
A: The cash flow statement is prepared to estimate the net cash inflow or outflow from the business…
Q: How much is the total current assets for the year ended December 31, 2016? A. 2,505,000 В. 2,430,000…
A: Current assets can be defined as the assets that are kept for short-term period, that is usually for…
Q: Only the Market Value Ratio. Lan & Chen Technologies: Income Statements for Year Ending…
A: Market Value Ratio are those ratios that helps in deciding whether market price of share is…
Q: This problem is based on the 2017 annual report of Campbell Soup Company. Answer the following…
A: Consolidated financial statements: These financial statements are consolidated financial statements…
Q: Completing a comprehensive financial statement analysis In its annual report, XYZ Athletic Supply,…
A:
Q: Computing Asset Ratios The following information relates to Mazy's Inc. $ millions Total Assets…
A: Asset turnover ratio measures the effectiveness in which the business uses its total assets to…
Q: Note Current assets (R327 500) include accounts receivable of R168 000, inventories of R75 000 and…
A: Hi student Since there are multiple subparts, we will answer only first three subparts.
Q: E7.11 For Domino's Pizza (DPZ), the following information on the past 5 years' revenues can be found…
A: Revenues is the amount realized by a business on the sale of its products and services. Revenues is…
Q: Assume that sales revenue in 2022 changed to S755,00 and cost of goods changed to S512,000. Income…
A: Formula: Net Income = Revenues - expenses Gross profit = sales revenue - cost of goods sold
Q: BALANCE SHEETS 2015 Assets $ 5,000 Cash 3,800 ST Investments 200 Accounts receivable Inventories…
A: Average Sales Period: The average sales for your chosen period may be calculated by taking the total…
Q: Net income was $520.000 in 2020. S452.400 in 2021, and $524,784 in 2022. What is the percentage of…
A:
Q: $75,000,000 $80,000,000 2017 Total assets 2018 Total assets $ 1,875,000 $ 1,925,000 $ 4,525,000 $…
A: ROI stands for Return on investment that shows the percentage of return received from the invested…
Q: How to convert a balance sheet to a common size balance sheet
A: Common-sized financial statements: Common-sized financial statements are useful for the analysts in…
Q: Lan & Chen Technologies: Income Statements for Year Ending December 31…
A: Hey, since there are multiple sub-part questions posted, we will answer the first three questions.…
Q: Comprehensive Income December 31, 2017 and 2018 2017 4,551,000 Increase/Decrease Peso Percent 2018…
A: Horizonal Analysis Horizontal analysis is one of the method to use to measure the financial strength…
Q: NATIONAL CO.: INCOME STATEMENTS FOR YEAR ENDING DECEMBER 31 (MILLIONS OF PHP) 2021 P3,600.0 P3,000.0…
A: Working capital is the amount that is determined by subtracting the current liabilities from the…
Q: Operating data for Coronado Corporation are presented as follows. 2022 2021 Net sales…
A: Vertical analysis: It is a method of analyzing the financial statement in which each item is shows…
Q: ow much is the total deferred charges in 2023?
A: Basic Concept of Accounting Deferred Charges
Q: FINANCIAL STATEMENT ANALYSIS DATA INFORMATION Statement of Financial Position of cf company…
A: Hi student Since there are multiple subparts, we will answer only first three subparts.
Q: Research and Development Expense International Business Machines Corporation (IBM) reported the…
A: Here, millions 2018…
Q: Lan & Chen Technologies: Income Statements for Year Ending December 31…
A: Ratio Analysis: Ratio analysis helps in getting an idea about an entity's operational efficiency,…
Q: Balance Sheet at End of Year- figures in millions Assets 2015 2016 Liability…
A: Please refer to the table below for the calculation of income tax and net income for FY2016.…
Q: 2016 2015 Assets Property, plant, and equipment (net) OMR 94,500 OMR 90,000 Intangibles 33,500…
A: The statement of financial position includes the assets, liabilities, and stockholders' equity of…
Q: International Industries-5 Year Selected Financial Data 2019 2018 2017 2016 2015 Net Sales 491,190…
A: Sales: Sales include a number of goods and services sold by the organization during their accounting…
Q: Using the financial statements in the image, calculate the following ratios for both the FY 2017 and…
A: Ratio analysis is a tool used by the various people to analyze the financial statement of a company.…
Q: Translation and Remeasurement Gains and Losses Amcrest France Sarl, located in Paris France, is a…
A: Financial statements is a part of reporting and displaying the financial activities and position of…
Q: (In millions) 2019 2018 2017 2016 Revenue $ 9,610 $ 9,355 $ 9,050 $ 8,950 Net Income 7,290 6,790…
A: Formula: 2017 year value = ( 2017 value / 2016 value ) x 100
Q: International Business Machines Corporation (IBM) reported the following on its 2018 form 10‑K. $…
A: RD&E expense common-size = Research, development and engineering expense x 100 / Total revenue
Q: Fixed assets. Use the data from the following financial statements in the popup window, E- What are…
A: Net Fixed Assets is defined as purchase price of the fixed assets such as land, equipment,…
Q: Starbuc * Vertical Analysis Recent Year Amount (in millions) Recent Year Percent Prior Year Amount…
A: Vertical analysis is a way of examining financial statements in which each line item is listed as a…
Q: Suppose McDonald's 2022 financial statements contain the following selected data (in millions).…
A: Times interest earned also known as interest coverage ratio indicates how often the interest charges…
Q: NATIONALCO INCOME STATEMENTS FOR YEAR ENDING DECEMBER 31 (MILLIONS OF PHP) 2022 P3,600.0 P3,000.0…
A: Ratio analysis: It is a way of determining a company's liquidity, profitability, and efficiency.…
Q: Starbucks Corpora * Vertical Analysis Prior Year Prior Year Percent Recent Year Recent Year Percent…
A: Formula: Recent year Percent: Americas = ( Americas value / Total revenues ) x 100
Q: Capital 1 January 2019 350 000 Drawings 20 000 Sales (70% on credit) 950 000 Gross profit 250…
A:
Q: Using the financial statements in the image, calculate the following ratios for both the FY 2017 and…
A: Ratio analysis is a tool used by the various people to analyze the financial statement of a company.…
Q: Find the following financial ratios
A: Short term solvency ratios are the financial ratios for finding the liquidity of the currents…
Q: E18-2 Operating data for Navarro Corporation are presented below. 2017 2016 Net sales Cost of goods…
A: The profitability position of the company can be arrived from the income statement prepared by the…
Q: STATEMENT OF FINANCIAL POSITION AS AT 31 DECEMBER 2016 (Expressed in Trinidad and Tobago Dollars)…
A: Earnings per share can be defined as the proportion of profit which is allocated by the company to…
Q: NATIONAL CO.: INCOME STATEMENTS FOR YEAR ENDING DECEMBER 31 (MILLIONS OF PHP) 2022 P3,600.0 P3,000.0…
A: Ratio Analysis - The ratio is the technique used by the prospective investor or an individual or…
Q: Northern Systems reported the following financlal data (in millions) In its annual report: 2018 2019…
A: Return on assets ratio = Net income / Average Assets Assets turnover ratio = Sales / Average Assets…
Q: E18-4 Vertical analysis of a balance sheet [10–15 min] Beta Graphics Pty Ltd has the following data:…
A:
What was the

Step by step
Solved in 2 steps

- Please help in Ratio analysis Lan & Chen Technologies: Income Statements for Year Ending December 31 (Thousands of Dollars) 2018 2017 Sales $945,000 $900,000 Expenses excluding depreciation and amortization 812,700 774,000 EBITDA $132,300 $126,000 Depreciation and amortization 33,100 31,500 EBIT $99,200 $94,500 Interest Expense 10,470 8,600 EBT $88,730 $85,900 Taxes (40%) 35,492…Please help in Ratio analysis Lan & Chen Technologies: Income Statements for Year Ending December 31 (Thousands of Dollars) 2018 2017 Sales $945,000 $900,000 Expenses excluding depreciation and amortization 812,700 774,000 EBITDA $132,300 $126,000 Depreciation and amortization 33,100 31,500 EBIT $99,200 $94,500 Interest Expense 10,470 8,600 EBT $88,730 $85,900 Taxes (40%) 35,492…Please help on ratio analysis Lan & Chen Technologies: Income Statements for Year Ending December 31 (Thousands of Dollars) 2018 2017 Sales $945,000 $900,000 Expenses excluding depreciation and amortization 812,700 774,000 EBITDA $132,300 $126,000 Depreciation and amortization 33,100 31,500 EBIT $99,200 $94,500 Interest Expense 10,470 8,600 EBT $88,730 $85,900 Taxes (40%) 35,492…
- AE COM LTD Comparative Balance Sheet December 30, 2018 and 2017 2018 2017 Increase/(Decrease) Assets Cash 110,000 70,000 ? Accounts Receivable 300,000 325,000 ? Supplies 350,000 280,000 ? Prepaid expenses 35,000 28,000 ? Intangible assets 215,000 215,000 ? Equipment, net 1,200,000 980,000 ? Total Assets 2,210,000 1,898,000 Liabilities Accounts payable 250,000 140,000 ? Accrued liabilities 210,000 215,000 ? Income tax payable 78,000 98,500 ? Long-term notes payable 602,000 725,000 ? Stockholders' Equity Common Stock 410,000 330,000 ? Retained earnings 730,000…What is Yahoo’s common-sized product development expense for 2017? (Rounded to two decimal places, in percentage format). $ in millions Dec 31, 2017 Dec 31, 2016 Total Assets $17,103.30 $16,805.00 Revenues 4,984.20 4,986.60 Product development exp 919.40 885.80 Operating Expense 3,102.00 3,007.80 Net Income $1,048.80 $1,093.00Operating data for Coronado Corporation are presented as follows. 2022 2021 Net sales $754,000 $595,000 Cost of goods sold 468,234 391,510 Selling expenses 125,164 67,830 Administrative expenses 63,336 55,930 Income tax expense 35,438 27,965 Net income 61,828 51,765 Prepare a schedule showing a vertical analysis for 2022 and 2021. (Round answers to 1 decimal place, e.g. 48.5%.)
- Please help me on Ratio Analysis below. Lan & Chen Technologies: Income Statements for Year Ending December 31 (Thousands of Dollars) 2018 2017 Sales $945,000 $900,000 Expenses excluding depreciation and amortization 812,700 774,000 EBITDA $132,300 $126,000 Depreciation and amortization 33,100 31,500 EBIT $99,200 $94,500 Interest Expense 10,470 8,600 EBT $88,730 $85,900 Taxes (40%) 35,492 34,360 Net income $53,238 $51,540 Common dividends $43,300 $41,230 Addition to retained earnings $9,938 $10,310 Lan & Chen Technologies: December 31 Balance Sheets (Thousands of Dollars) Assets 2018 2017 Cash and cash equivalents $47,250 $45,000 Short-term investments 3,800 3,400 Accounts Receivable 283,500 269,000 Inventories 141,750 136,000 Total current assets $476,300 $453,400 Net fixed assets 330,750…If answered within 30mins,it would be appreciable!!! Q3. XYZ Company has the following financial data: Particulars Amounts (SAR) Total Profit for the Year 377,500 General Takaful Assets (Year 2014) 1,390,000 General Takaful Assets (Year 2015) 1,517,500 Cash 11,500 Short-term Investment 23,500 Short term liabilities 85,000 Underwriting Surplus Distributable to Participants/Participants' Share of Profit 145,500 Gross Contribution 958,000 Net Contribution 662,500 Wakalah Fee 77,500 Commission Paid 28,300 Management Expense 58,000 Net Claim Incurred 287,500 Earned Contribution 632,500 You are required to calculate: Return on Assets Quick Liquidity Surplus Distribution Ratio Expense Ratio Claims Ratio This all question nothing moreQuestion C5 Majan Ltd income statement for the year ended 31st Dec 2020 and the balance sheets as at 31st Dec 2009 and 2019 are as follows: Income statement OMR in million Revenue 312 Cost of sales (177) Gross profit 135 Distribution expenses (36) Administrative expenses (15) 84 Rental income 14 Operating profit 98 Interest payable (13) Profit before taxation 85 Taxation (18) Profit for the year 67 Balance sheet as at 31st Dec 2020 and 2019 2020 2019 OMR in million OMR in million Non – current assets Property, plant and equipment Land and buildings 155 155 Plant and machinery 157 163 312 318 Current assets Inventories 18 21 Trade receivables 73 70 Current liabilities…
- Which is an example of horizontal analysis? A. Operating income amounts to P20,000. B. Acurrent ratio of 1:2 is established. C. Rent income in 2021 is 15% greater than in 2020. D. Advertising expense in 2021 is 6% of sales.Cisco SystemsConsolidated Statements of Income Years Ended December ($ millions) July 27, 2019 July 28, 2018 Revenue Product $39,005 $36,709 Service 12,899 12,621 Total revenue 51,904 49,330 Cost of sales Product 14,863 14,427 Service 4,375 4,297 Total cost of sales 19,238 18,724 Gross margin 32,666 30,606 Operating expenses Research and development 6,577 6,332 Sales and marketing 9,571 9,242 General and administrative 1,827 2,144 Amortization of purchased intangible assets 150 221 Restructuring and other charges 322 358 Total operating expenses 18,447 18,297 Operating income 14,219 12,309 Interest income 1,308 1,508 Interest expense -859 -943 Other income (loss), net -97 165 Interest and other income (loss), net 352 730 Income before provision for income taxes 14,571 13,039 Provision for income taxes 2,950 12,929 Net income $11,621 $110 Cisco Systems Inc.Consolidated…Cisco SystemsConsolidated Statements of Income Years Ended December ($ millions) July 27, 2019 July 28, 2018 Revenue Product $39,005 $36,709 Service 12,899 12,621 Total revenue 51,904 49,330 Cost of sales Product 14,863 14,427 Service 4,375 4,297 Total cost of sales 19,238 18,724 Gross margin 32,666 30,606 Operating expenses Research and development 6,577 6,332 Sales and marketing 9,571 9,242 General and administrative 1,827 2,144 Amortization of purchased intangible assets 150 221 Restructuring and other charges 322 358 Total operating expenses 18,447 18,297 Operating income 14,219 12,309 Interest income 1,308 1,508 Interest expense -859 -943 Other income (loss), net -97 165 Interest and other income (loss), net 352 730 Income before provision for income taxes 14,571 13,039 Provision for income taxes 2,950 12,929 Net income $11,621 $110 Cisco Systems Inc.Consolidated Balance Sheets In millions, except par value July…