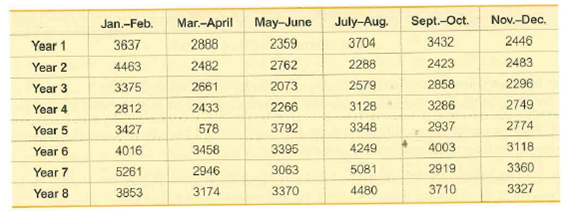
Sept.-Oct. 3432 Nov.-Dec. Mar.-April July-Aug. 3704 2288 Jan.-Feb. 3637 May-June 2359 Year 1 2446 2888 2482 2762 2423 Year 2 4463 2483 2073 2579 3128 3348 2858 Year 3 2661 3375 2296 2749 3286 2266 2812 2433 Year 4 2937 2774 578 3427 Year 5 3792 3395 4003 3118 4249 4016 3458 Year 6 3360 2919 2946 5081 Year 7 5261 3063 3370 3710 3327 4480 3853 3174 Year 8


Unitary Method
The word “unitary” comes from the word “unit”, which means a single and complete entity. In this method, we find the value of a unit product from the given number of products, and then we solve for the other number of products.
Speed, Time, and Distance
Imagine you and 3 of your friends are planning to go to the playground at 6 in the evening. Your house is one mile away from the playground and one of your friends named Jim must start at 5 pm to reach the playground by walk. The other two friends are 3 miles away.
Profit and Loss
The amount earned or lost on the sale of one or more items is referred to as the profit or loss on that item.
Units and Measurements
Measurements and comparisons are the foundation of science and engineering. We, therefore, need rules that tell us how things are measured and compared. For these measurements and comparisons, we perform certain experiments, and we will need the experiments to set up the devices.
Energy Consumption. Exercises 1-5 refer to the amounts of energy consumed in the author’s home. (Most of the data are real, but some are fabricated.) Each value represents energy consumed (kWh) in a two-month period. Let each subgroup consist of the six amounts within the same year. Data are available for download at www.TriolaStats.com
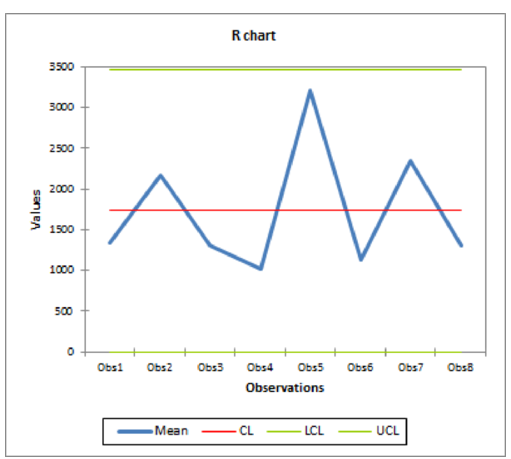
Let each subgroup consist of the 6 values within a year. Construct an R chart and determine whether the process variation is within statistical control. If it is not, identify which of the three out-of-control criteria lead to rejection of statistically stable variation.
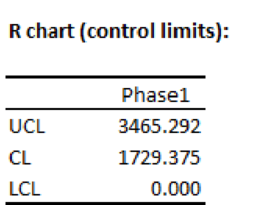
Note: In this scenario, XLSTAT software is used to obtain R-chart.
Requirements for the out-of-control state:
A process is said to be out-of-statistical control if any one of the following requirements are satisfied:
- There exists an upward or downward trend or a cyclic pattern.
- The sample point lies below the lower control limit or above the upper control limit.
- There exist at least 8 consecutive sample points above or below the central line. It is known as the Run Rule of 8.
Step-by-step procedure to obtain the ‘Statistical process control’ using the XLSTAT software:
- Choose Statistical Process Control (SPC) > Subgroup charts.
- Select Chart type as R chart.
- Choose General.
- Mark Columns under Data format.
- Select input range ‘A1:E9’ under Data.
- Click OK.
Output using the XLSTAT software is given below:

Step by step
Solved in 3 steps with 2 images


