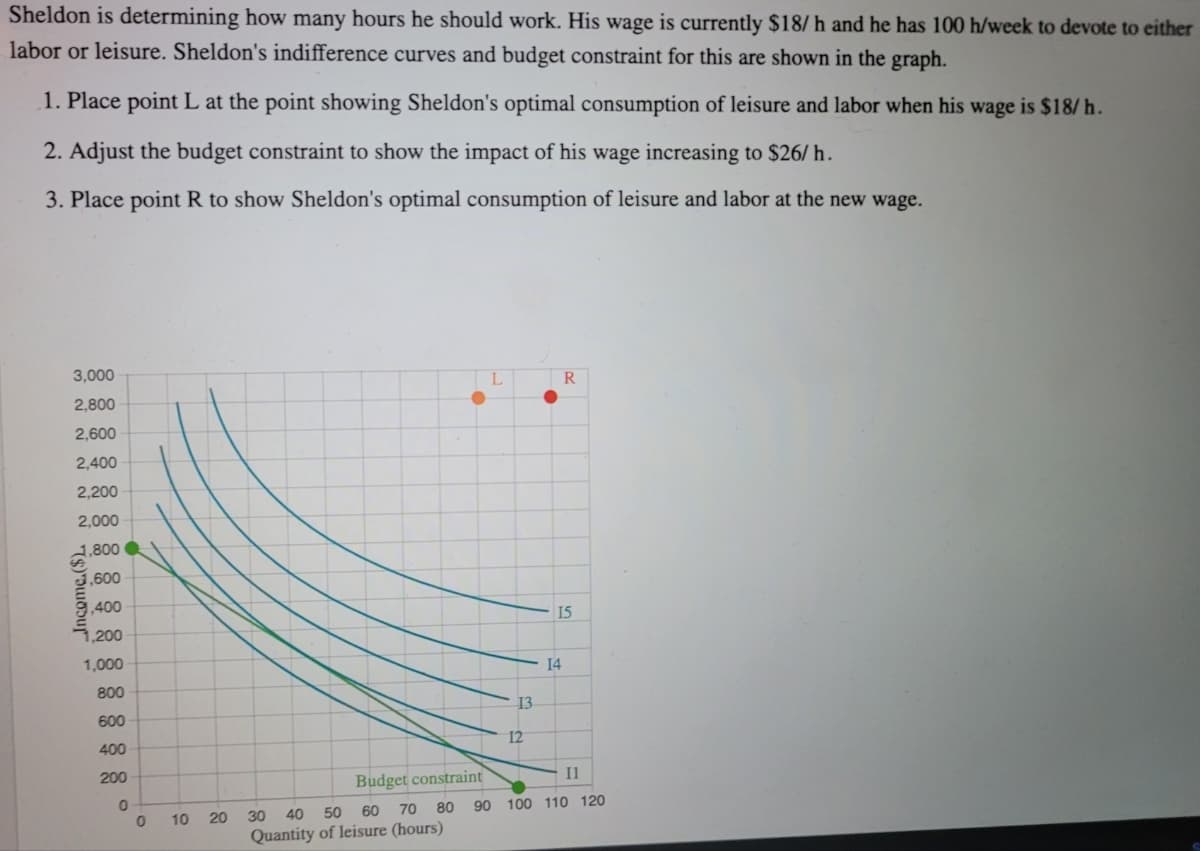
Sheldon is determining how many hours he should work. His wage is currently $18/h and he has 100 h/week to devote to either labor or leisure. Sheldon's indifference curves and budget constraint for this are shown in the graph. 1. Place point L at the point showing Sheldon's optimal consumption of leisure and labor when his wage is $18/ h. 2. Adjust the budget constraint to show the impact of his wage increasing to $26/ h. 3. Place point R to show Sheldon's optimal consumption of leisure and labor at the new wage. 3,000 R 2,800 2,600 2,400 2,200 2,000 2.800 3,600 3,400 15 7,200 1,000 14 800 13 600 400 12 200 Budget constraint Il 30 40 50 60 70 80 90 100 110 120 10 20 Quantity of leisure (hours)
Sheldon is determining how many hours he should work. His wage is currently $18/h and he has 100 h/week to devote to either labor or leisure. Sheldon's indifference curves and budget constraint for this are shown in the graph. 1. Place point L at the point showing Sheldon's optimal consumption of leisure and labor when his wage is $18/ h. 2. Adjust the budget constraint to show the impact of his wage increasing to $26/ h. 3. Place point R to show Sheldon's optimal consumption of leisure and labor at the new wage. 3,000 R 2,800 2,600 2,400 2,200 2,000 2.800 3,600 3,400 15 7,200 1,000 14 800 13 600 400 12 200 Budget constraint Il 30 40 50 60 70 80 90 100 110 120 10 20 Quantity of leisure (hours)

Principles of Microeconomics
7th Edition
ISBN:9781305156050
Author:N. Gregory Mankiw
Publisher:N. Gregory Mankiw
Chapter21: The Theory Of Consumer Choice
Section: Chapter Questions
Problem 1PA

Related questions
Question
Please see below. I need assistance on this graphing problem.
Transcribed Image Text:Sheldon is determining how many hours he should work. His wage is currently $18/ h and he has 100 h/week to devote to either
labor or leisure. Sheldon's indifference curves and budget constraint for this are shown in the graph.
1. Place point L at the point showing Sheldon's optimal consumption of leisure and labor when his wage is $18/ h.
2. Adjust the budget constraint to show the impact of his wage increasing to $26/ h.
3. Place point R to show Sheldon's optimal consumption of leisure and labor at the new wage.
3,000
L
R
2,800
2,600
2,400
2,200
2,000
1,800
3,600
9,400
15
,200
1,000
14
800
13
600
12
400
200
Budget constraint
I1
70 80
90 100 110 120
20
30
40
50 60
10
Quantity of leisure (hours)
Expert Solution
This question has been solved!
Explore an expertly crafted, step-by-step solution for a thorough understanding of key concepts.

This is a popular solution!

Trending now
This is a popular solution!

Step by step
Solved in 2 steps with 1 images

Follow-up Questions
Read through expert solutions to related follow-up questions below.
Follow-up Question
This is not the same problem, I need help with the problem i submitted

Transcribed Image Text:Tutorial 11: Identifying a triangular area on a graph
You will encounter some questions that will require you to identify an area on the graph using either a triangle or a rectangle. This tutorial lets you practice using a
triangle; the next tutorial covers the rectangle.
For these types of questions, you will click the plotter tool on the graph. This will place a triangle on the graph with its end points as circles. This indicates that you
can click and drag the end points to place the triangle over the area required.
Instructions: On the graph below click the 3-pointer shader tool 'Fill', and then click anywhere on the graph. This will place a triangle
on the graph. Click and drag the end points (vertices) of the triangle so that the triangle highlights the area from:
• O on the x (quantity) axis and 8 on the y (price) axis
• 0 on the x axis and 5 on the y axis
• 3 on the x axis and 5 on the y axis
S₁
8
5
P₂
K
3
D₂
1 2 3 4 5
Price
10
9
6
Quantity
7 8 9 10
Tools
.Å.
Fill
Ⓡ
Solution
Knowledge Booster


Learn more about
Need a deep-dive on the concept behind this application? Look no further. Learn more about this topic, economics and related others by exploring similar questions and additional content below.Recommended textbooks for you
Principles of Microeconomics
Economics
ISBN:
9781305156050
Author:
N. Gregory Mankiw
Publisher:
Cengage Learning

Principles of Economics (MindTap Course List)
Economics
ISBN:
9781305585126
Author:
N. Gregory Mankiw
Publisher:
Cengage Learning

Economics: Private and Public Choice (MindTap Cou…
Economics
ISBN:
9781305506725
Author:
James D. Gwartney, Richard L. Stroup, Russell S. Sobel, David A. Macpherson
Publisher:
Cengage Learning
Principles of Microeconomics
Economics
ISBN:
9781305156050
Author:
N. Gregory Mankiw
Publisher:
Cengage Learning
Principles of Economics (MindTap Course List)
Economics
ISBN:
9781305585126
Author:
N. Gregory Mankiw
Publisher:
Cengage Learning
Economics: Private and Public Choice (MindTap Cou…
Economics
ISBN:
9781305506725
Author:
James D. Gwartney, Richard L. Stroup, Russell S. Sobel, David A. Macpherson
Publisher:
Cengage Learning

Microeconomics: Private and Public Choice (MindTa…
Economics
ISBN:
9781305506893
Author:
James D. Gwartney, Richard L. Stroup, Russell S. Sobel, David A. Macpherson
Publisher:
Cengage Learning

