
MATLAB: An Introduction with Applications
6th Edition
ISBN: 9781119256830
Author: Amos Gilat
Publisher: John Wiley & Sons Inc
expand_more
expand_more
format_list_bulleted
Related questions
Concept explainers
Question
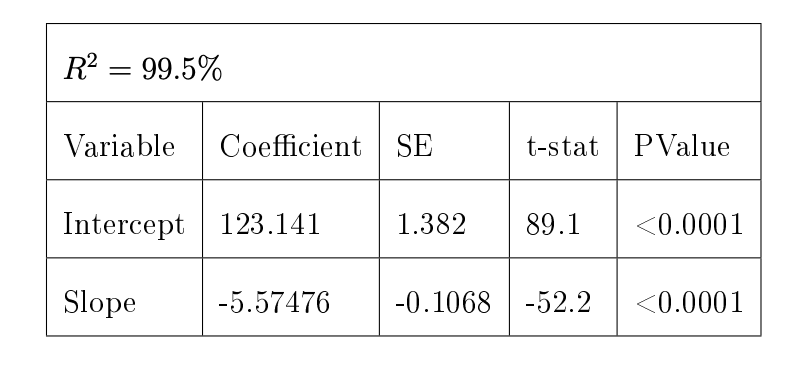
Shown below is output for
1. What is the estimated regression equation that relates Y to X?
2. Is there a linear association between dependent and independent variable? Test the hypothesis at α = 0.05
3. What is the estimated value of Y if the value of X is 4.5?

Expert Solution
This question has been solved!
Explore an expertly crafted, step-by-step solution for a thorough understanding of key concepts.

Step by stepSolved in 2 steps

Knowledge Booster


Learn more about
Need a deep-dive on the concept behind this application? Look no further. Learn more about this topic, statistics and related others by exploring similar questions and additional content below.Similar questions
- 4. A study was conducted to investigate the relationship between the size of a house (in square feet) and the selling price of a house (in dollars). The response variable is price in dollars, and we want to study if the covariate of the square footage helps explain the response. A random sample of 522 houses was used, and the linear regression output from R is below. price sqft, data = house) 1m (formula = Coefficients: Estimate Std. Error t value Pr(>|t|) (Intercept) -81432.946 11551.846 -7.049 5.74e-12 *** sqft 158.950 4.875 32.605 <2e-16 *** Residual standard error: 79120 on 520 degrees of freedom Multiple R-squared: 0.6715, Adjusted R-squared: 0.6709 a. Write out the estimated linear equation. What is the estimated expected selling price of a house that is 2000 square feet? b. Does the intercept have a useful interpretation in this study? Why or why not. c. Interpret the slope estimate in context of the model.arrow_forwardThe Toyota Camry is one of the best-selling cars in North America. The cost of a previously owned Camry depends upon many factors, including the model year, mileage, and condition. To investigate the relationship between the car's mileage and the sales price for a 2007 model year Camry, the following data show the mileage and sale price for 19 sales (PriceHub website). Click on the datafile logo to reference the data. DATA file 1. 18 Price ($1000s) 16 14 12 10 18 6 If your answer is zero, enter "0". a. Select a scatter diagram with the car mileage on the horizontal axis and the price on the vertical axis. 20 40 6,0 8,0 100 Miles (1000s) 120 223 +♡ ♡ Miles(1000s) 29 36 47 63 77 73 87 92 101 110 28 59 68 68 91 42 65 110 Price ($1000s) 16.2 16.0 13.8 11.5 12.5 12.9 11.2 13.0 11.8 10.8 8.3 12.5 11.1 15.0 12.2 13.0 15.6 12.7 8.3arrow_forwardThe flow rate in a device used for air quality measurement depends on the pressure drop x (inches of water) across the device's filter. Suppose that for x values between 5 and 20, these two variables are related according to the simple linear regression model with true regression line y = -0.11 + 0.097x. (a.1) What is the true average flow rate for a pressure drop of 10 in.?(a.2) A drop of 15 in.?(b) What is the true average change in flow rate associated with a 1 inch increase in pressure drop?(c) What is the average change in flow rate when pressure drop decreases by 5 in.?arrow_forward
- If the R-squared for a regression model relating the outcome y to an explanatory variable x is 0.9. This implies that there is a positive linear relationship between y and x. True or false?arrow_forward13/arrow_forwardSelect the appropriate interpretation for the slope of the linear regression equation below. Y (Dependent Variable) = Grade Point Average X (Independent Variable) = Average number of hours spent using electronic devices for entertainment purposes yhat = 4 - 0.125*X A. For every 1 hour more spent using electronic devices for entertainment per week then a person's GPA will increase on average by 0.125 points B. For every 1 GPA gained obtained by a student then on average that person will have watched 0.125 hours fewer of entertainment on electronic devices per week C. For every 1 GPA point lost by a student then on average that person will have watched 0.125 hours more of entertainment on electronic devices per week D. For every 1 hour more spent using electronic devices for entertainment per week then a person's GPA will decrease on average by 0.125 pointsarrow_forward
- You may need to use the appropriate technology to answer this question. A regression analysis involving 45 observations relating a dependent variable and two independent variables resulted in the following information. ý = 0.406 + 1.3385X, + 2X2 The SSE for the above model is 43. When two other independent variables were added to the model, the following information was provided. ý = 1.9 – 3X + 12X2 + 4Xg + 8x, This model's SSE is 36. At a 0.05 level of significance, test to determine if the two added independent variables contribute significantly to the model. State the relevant null and alternative hypotheses. O Ho: One or more of the parameters is not equal to zero. H₂: B₁ = B₂= B3 =B4 = 0 O Ho: One or more of the parameters is not equal to zero. H₂: B3 =B4 = 0 O Ho: B3 = P4 = 0 H₂: None of the parameters are equal to zero. ⒸH₁: B3 =B₁ = 0 H: One or more of the parameters is not equal to zero. O Ho: B₁ = P₂ = B3 =B4 = 0 H: One or more of the parameters is not equal to zero. ✔ Find…arrow_forwardA particular article used a multiple regression model to relate y = yield of hops to x, = average temperature (°C) between date of coming into hop and date of picking and x, = average percentage of sunshine during the same period. The model equation proposed is the following. y = 415.11 – 6.6x1 – 4.50x2 +e (a) Suppose that this equation describes the actual relationship. What mean yield corresponds to a temperature of 20 and a sunshine percentage of 40? (b) What is the mean yield when the average temperature and average percentage of sunshine are 19 and 44, respectively?arrow_forwardThe following data shows memory scores collected from adults of different ages. Age (X) Memory Score (Y) 25 10 32 10 39 9 48 9 56 7 Use the data to find the regression equation for predicting memory scores from age. The regression equation is: Ŷ = 4.33X + 0.11 Ŷ = -0.11X + 4.33 Ŷ = -0.11X + 13.26 Ŷ = -0.09X + 5.4 Ŷ = -0.09X + 12.6 Use the regression equation you found in question 6 to find the predicted memory scores for the following age: 28 For the calculations, leave two places after the decimal point and do not round: Use the regression equation you found in question 6 to find the predicted memory scores for the following age: 43 For the calculations, leave two places after the decimal point and do not round: Use the regression equation you found in question 6 to find the predicted memory scores for the following age: 50 For the calculations, leave two places after the decimal point and do not round:arrow_forward
- In a fisheries researchers experiment the correlation between the number of eggs in tge nest and the number of viable (surviving ) eggs for a sample of nests is r=0.67 the equation of the regression line for number of viable eggs y versus number of eggs in the nest x is y =0.72x + 17.07 for a nest with 140 eggs what is the predicted number of viable eggs ?arrow_forwardA linear regression analysis reveals a strong, negative linear relationship between x and y. Which of the following could possibly be the results from this analysis? (A) ŷ 13.1 27.4x, r = 0.85 (B) == 27.4+ 13.1x, r = -0.95 (D) == (C) ŷ 13.1+ 27.4x, r = 0.95 542 385x, r = -0.15 (E) 0.85 0.25x, r = -0.85arrow_forwardThis is my question! All parts please.arrow_forward
arrow_back_ios
arrow_forward_ios
Recommended textbooks for you
- MATLAB: An Introduction with ApplicationsStatisticsISBN:9781119256830Author:Amos GilatPublisher:John Wiley & Sons Inc
 Probability and Statistics for Engineering and th...StatisticsISBN:9781305251809Author:Jay L. DevorePublisher:Cengage Learning
 Statistics for The Behavioral Sciences (MindTap C...StatisticsISBN:9781305504912Author:Frederick J Gravetter, Larry B. WallnauPublisher:Cengage Learning
  Elementary Statistics: Picturing the World (7th E...StatisticsISBN:9780134683416Author:Ron Larson, Betsy FarberPublisher:PEARSON
 The Basic Practice of StatisticsStatisticsISBN:9781319042578Author:David S. Moore, William I. Notz, Michael A. FlignerPublisher:W. H. Freeman
 Introduction to the Practice of StatisticsStatisticsISBN:9781319013387Author:David S. Moore, George P. McCabe, Bruce A. CraigPublisher:W. H. Freeman
MATLAB: An Introduction with Applications
Statistics
ISBN:9781119256830
Author:Amos Gilat
Publisher:John Wiley & Sons Inc
Probability and Statistics for Engineering and th...
Statistics
ISBN:9781305251809
Author:Jay L. Devore
Publisher:Cengage Learning
Statistics for The Behavioral Sciences (MindTap C...
Statistics
ISBN:9781305504912
Author:Frederick J Gravetter, Larry B. Wallnau
Publisher:Cengage Learning
Elementary Statistics: Picturing the World (7th E...
Statistics
ISBN:9780134683416
Author:Ron Larson, Betsy Farber
Publisher:PEARSON
The Basic Practice of Statistics
Statistics
ISBN:9781319042578
Author:David S. Moore, William I. Notz, Michael A. Fligner
Publisher:W. H. Freeman
Introduction to the Practice of Statistics
Statistics
ISBN:9781319013387
Author:David S. Moore, George P. McCabe, Bruce A. Craig
Publisher:W. H. Freeman