
MATLAB: An Introduction with Applications
6th Edition
ISBN: 9781119256830
Author: Amos Gilat
Publisher: John Wiley & Sons Inc
expand_more
expand_more
format_list_bulleted
Related questions
Question
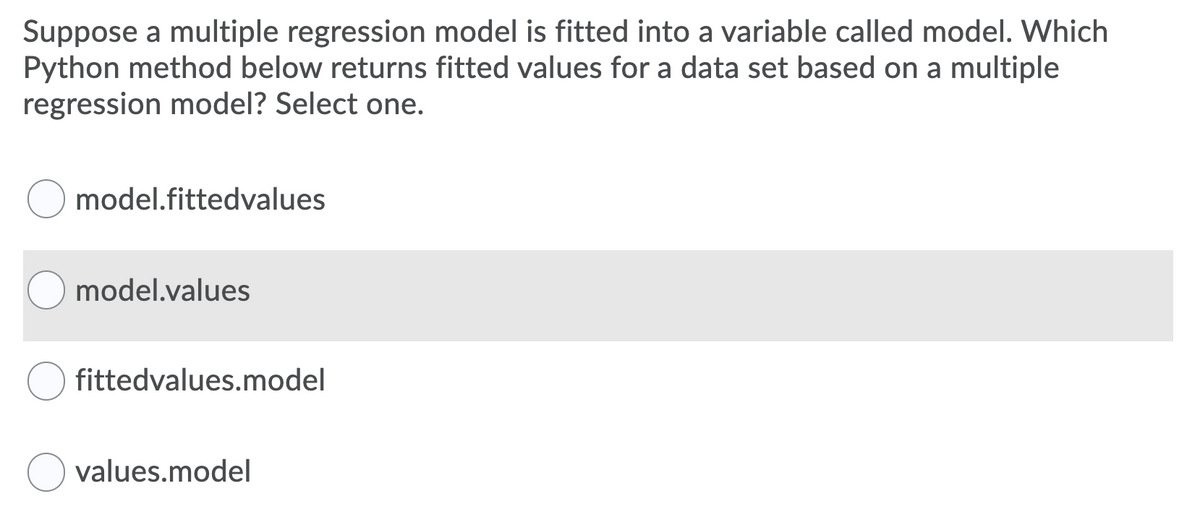

Transcribed Image Text:Suppose a multiple regression model is fitted into a variable called model. Which
Python method below returns fitted values for a data set based on a multiple
regression model? Select one.
model.fittedvalues
model.values
fittedvalues.model
values.model
Expert Solution
This question has been solved!
Explore an expertly crafted, step-by-step solution for a thorough understanding of key concepts.

This is a popular solution

Trending nowThis is a popular solution!

Step by stepSolved in 2 steps

Knowledge Booster

Similar questions
- For the provided data, develop a regression model for overall satisfaction as a function of years of service and department that has the largest R. Note that the categorical variable department has multiple levels and will require the use of multiple dummy variables. Which department, if any, has the highest impact on roduction satisfaction? Production Production E Click the icon to view the job satisfaction data. Determine the regression model for overall satisfaction as a function of years of service and department that has the largest R. Let "Administrative" be the baseline department, let X, represent Maintenance, let X, represent Management, let X, represent Production, let X, represent Quality Control, and let Xg represent Shipping / Receiving, coding each department variable with a 1 if the person is in that department and 0 otherwise. In addition, let Xe represent Years. Enter the terms of the equation so that the X-values are in ascending numerical order by base. Select the…arrow_forwardThe personnel director of a large hospital is interested in determining the relationship (if any) between an employee’s age and the number of sick days the employee takes per year. The director randomly selects ten employees and records their age and the number of sick days which they took in the previous year. Employee 1 2 3 4 5 6 7 8 9 10 Age 30 50 40 55 30 28 60 25 30 45 Sick Days 7 4 3 2 9 10 0 8 5 2 Copy Data The estimated regression line and the standard error are given. Sick Days=14.310162−0.2369(Age) se=1.682207se=1.682207 Find the 95% confidence interval for the average number of sick days an employee will take per year, given the employee is 26. Round your answer to two decimal places.arrow_forwardLeast squares practice find the best-fit line for the following data sets. Plot the points and the best-fit line. (0, 0), (2, 3), (4, 5)arrow_forward
- Fill in the blank. You are doing a study for a non-profit group helping at-risk children in your city. Suppose you know that 14.2% of the children in your city live in poverty. This percentage is an example of a You are doing a study for a non-profit group helping at-risk children in your city. Suppose you know that 14.2% of the children in your city live in poverty. This percentage is an example of a population parameter. sample statistic.arrow_forwardThe data show the chest size and weight of several bears. Find the regression equation, letting chest size be the independent (x) variable. Then find the best predicted weight of a bear with a chest size of 40 inches. Is the result close to the actual weight of 352 pounds? Use a significance level of 0.05. Chest size (inches) *Weight (pounds) 44 54 328 528 41 55 39 51 418 580 296 503 Click the icon to view the critical values of the Pearson correlation coefficient r. - What is the regression equation? x (Round to one decimal place as needed.)arrow_forwardReport the equation of the regression line and interpret it in the context of the problemarrow_forward
- The residual plot for a linear regression model is shown below. Assess the fit of the linear model, and justify your answer. The line is a good fit because the points on the residual plot have a clear pattern. The line is a good fit because the points on the residual plot do not have any noticeable pattern. The line is not a good fit because the points on the residual plot do not have any noticeable pattern. The line is not a good fit because the points on the residual plot have a clear pattern.arrow_forwardThe table shows the lengths and weights of seven muskies captured by the Department of Natural Resources in Catfish Lake in Eagle River, Wisconsin. Use the linear regression feature on a graphing calculator to determine an equation of the line that best fits the data. Round to the hundredths. Musky 1 2 3 4 5 6 7 Length (in.) 26 27 29 33 35 36 38 Weight (lb) 5 8 9 12 14 14 19arrow_forwardIn linear regression analysis, the coefficient for the x-variable when the y-variable is regressed on the x-variable can be thought of as: Note: more than one answer may be correct Group of answer choices How much the value of the predicted y-variable will change when the x-variable changes by one unit. In the simple (two variable) linear regression model, the coefficient can be thought as the slope coefficient that measures the responsiveness of y to changes in x. The estimated coefficient will change if the sample containing x and y changes. The sample coefficient is an estimate of the population coefficient Before interpreting the coefficient for the x-variable, we should test whether the coefficient is statistically significant.arrow_forward
arrow_back_ios
arrow_forward_ios
Recommended textbooks for you
- MATLAB: An Introduction with ApplicationsStatisticsISBN:9781119256830Author:Amos GilatPublisher:John Wiley & Sons Inc
 Probability and Statistics for Engineering and th...StatisticsISBN:9781305251809Author:Jay L. DevorePublisher:Cengage Learning
 Statistics for The Behavioral Sciences (MindTap C...StatisticsISBN:9781305504912Author:Frederick J Gravetter, Larry B. WallnauPublisher:Cengage Learning
  Elementary Statistics: Picturing the World (7th E...StatisticsISBN:9780134683416Author:Ron Larson, Betsy FarberPublisher:PEARSON
 The Basic Practice of StatisticsStatisticsISBN:9781319042578Author:David S. Moore, William I. Notz, Michael A. FlignerPublisher:W. H. Freeman
 Introduction to the Practice of StatisticsStatisticsISBN:9781319013387Author:David S. Moore, George P. McCabe, Bruce A. CraigPublisher:W. H. Freeman
MATLAB: An Introduction with Applications
Statistics
ISBN:9781119256830
Author:Amos Gilat
Publisher:John Wiley & Sons Inc
Probability and Statistics for Engineering and th...
Statistics
ISBN:9781305251809
Author:Jay L. Devore
Publisher:Cengage Learning
Statistics for The Behavioral Sciences (MindTap C...
Statistics
ISBN:9781305504912
Author:Frederick J Gravetter, Larry B. Wallnau
Publisher:Cengage Learning
Elementary Statistics: Picturing the World (7th E...
Statistics
ISBN:9780134683416
Author:Ron Larson, Betsy Farber
Publisher:PEARSON
The Basic Practice of Statistics
Statistics
ISBN:9781319042578
Author:David S. Moore, William I. Notz, Michael A. Fligner
Publisher:W. H. Freeman
Introduction to the Practice of Statistics
Statistics
ISBN:9781319013387
Author:David S. Moore, George P. McCabe, Bruce A. Craig
Publisher:W. H. Freeman