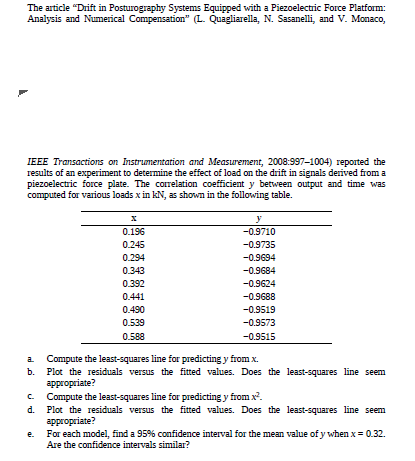
The article "Drift in Posturography Systems Equipped with a Piezoelectric Force Platform: Analysis and Numerical Compensation" (L. Quagliarella, N. Sasanelli, and Vv. Monaco, IEEE Transactions on Instrumentation and Measurement, 2008:997-1004) reported the results of an experiment to determine the effect of load on the drift in signals derived from a piezoelectric force plate. The corelation coefficient y between outpuit and time was computed for various loads x in kN, as shown in the following table. У 0.196 -0.9710 0.245 -0.9735 0.294 -0.9694 0.343 -0.9684 0.392 -0.9624 0.441 -0.9688 0.490 -0.9519 0.539 -0.9573 0.588 -0.9515 Compute the least-squares line for predicting y from x. Plot the residuals versus the fitted values. Does the least-squares line seem appropriate? Compute the least-squares line for predicting y from x. d. Plot the residuals versus the fitted values. Does the least-squares line seem appropriate? C. For each model, find a 95% confidence interval for the mean value of y when x= 0.32. Are the confidence intervals similar? e.
The article "Drift in Posturography Systems Equipped with a Piezoelectric Force Platform: Analysis and Numerical Compensation" (L. Quagliarella, N. Sasanelli, and Vv. Monaco, IEEE Transactions on Instrumentation and Measurement, 2008:997-1004) reported the results of an experiment to determine the effect of load on the drift in signals derived from a piezoelectric force plate. The corelation coefficient y between outpuit and time was computed for various loads x in kN, as shown in the following table. У 0.196 -0.9710 0.245 -0.9735 0.294 -0.9694 0.343 -0.9684 0.392 -0.9624 0.441 -0.9688 0.490 -0.9519 0.539 -0.9573 0.588 -0.9515 Compute the least-squares line for predicting y from x. Plot the residuals versus the fitted values. Does the least-squares line seem appropriate? Compute the least-squares line for predicting y from x. d. Plot the residuals versus the fitted values. Does the least-squares line seem appropriate? C. For each model, find a 95% confidence interval for the mean value of y when x= 0.32. Are the confidence intervals similar? e.

MATLAB: An Introduction with Applications
6th Edition
ISBN:9781119256830
Author:Amos Gilat
Publisher:Amos Gilat
Chapter1: Starting With Matlab
Section: Chapter Questions
Problem 1P

Related questions
Question
Transcribed Image Text:The article "Drift in Posturography Systems Equipped with a Piezoelectric Force Platform:
Analysis and Numerical Compensation" (L. Quagliarella, N. Sasanelli, and Vv. Monaco,
IEEE Transactions on Instrumentation and Measurement, 2008:997-1004) reported the
results of an experiment to determine the effect of load on the drift in signals derived from a
piezoelectric force plate. The corelation coefficient y between outpuit and time was
computed for various loads x in kN, as shown in the following table.
У
0.196
-0.9710
0.245
-0.9735
0.294
-0.9694
0.343
-0.9684
0.392
-0.9624
0.441
-0.9688
0.490
-0.9519
0.539
-0.9573
0.588
-0.9515
Compute the least-squares line for predicting y from x.
Plot the residuals versus the fitted values. Does the least-squares line seem
appropriate?
Compute the least-squares line for predicting y from x.
d. Plot the residuals versus the fitted values. Does the least-squares line seem
appropriate?
C.
For each model, find a 95% confidence interval for the mean value of y when x= 0.32.
Are the confidence intervals similar?
e.
Expert Solution
This question has been solved!
Explore an expertly crafted, step-by-step solution for a thorough understanding of key concepts.

This is a popular solution!

Trending now
This is a popular solution!

Step by step
Solved in 8 steps with 6 images

Recommended textbooks for you
MATLAB: An Introduction with Applications
Statistics
ISBN:
9781119256830
Author:
Amos Gilat
Publisher:
John Wiley & Sons Inc

Probability and Statistics for Engineering and th…
Statistics
ISBN:
9781305251809
Author:
Jay L. Devore
Publisher:
Cengage Learning

Statistics for The Behavioral Sciences (MindTap C…
Statistics
ISBN:
9781305504912
Author:
Frederick J Gravetter, Larry B. Wallnau
Publisher:
Cengage Learning
MATLAB: An Introduction with Applications
Statistics
ISBN:
9781119256830
Author:
Amos Gilat
Publisher:
John Wiley & Sons Inc
Probability and Statistics for Engineering and th…
Statistics
ISBN:
9781305251809
Author:
Jay L. Devore
Publisher:
Cengage Learning
Statistics for The Behavioral Sciences (MindTap C…
Statistics
ISBN:
9781305504912
Author:
Frederick J Gravetter, Larry B. Wallnau
Publisher:
Cengage Learning

Elementary Statistics: Picturing the World (7th E…
Statistics
ISBN:
9780134683416
Author:
Ron Larson, Betsy Farber
Publisher:
PEARSON

The Basic Practice of Statistics
Statistics
ISBN:
9781319042578
Author:
David S. Moore, William I. Notz, Michael A. Fligner
Publisher:
W. H. Freeman

Introduction to the Practice of Statistics
Statistics
ISBN:
9781319013387
Author:
David S. Moore, George P. McCabe, Bruce A. Craig
Publisher:
W. H. Freeman