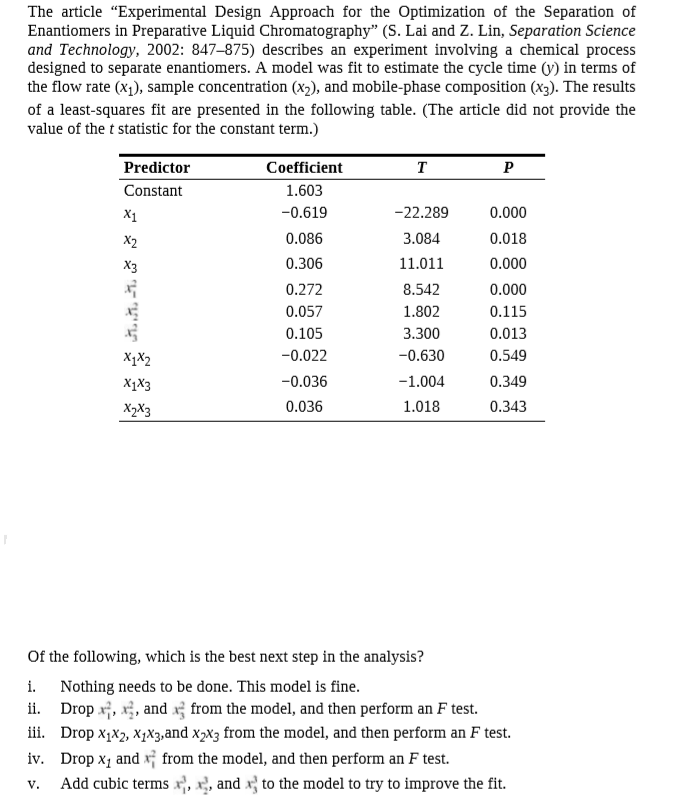
The article "Experimental Design Approach for the Optimization of the Separation of Enantiomers in Preparative Liquid Chromatography" (S. Lai and Z. Lin, Separation Science and Technology, 2002: 847–875) describes an experiment involving a chemical process designed to separate enantiomers. A model was fit to estimate the cycle time (y) in terms of the flow rate (x1), sample concentration (x2), and mobile-phase composition (x3). The results of a least-squares fit are presented in the following table. (The article did not provide the value of the t statistic for the constant term.) Predictor Coefficient т Constant 1.603 X1 -0.619 -22.289 0.000 X2 0.086 3.084 0.018 0.306 11.011 0.000 0.272 8.542 0.000 0.057 1.802 0.115 0.105 3.300 0.013 X1X2 -0.022 -0.630 0.549 XXз -0.036 -1.004 0.349 X>Xз 0.036 1.018 0.343 Of the following, which is the best next step in the analysis? i. Nothing needs to be done. This model is fine. Drop x;, x;, and x from the model, and then perform an F test. iii. Drop x1x2, X1X3,and x2x3 from the model, and then perform an F test. iv. Drop x, and x; from the model, and then perform an F test. Add cubic terms x, x, and x} to the model to try to improve the fit. ii. V.
The article "Experimental Design Approach for the Optimization of the Separation of Enantiomers in Preparative Liquid Chromatography" (S. Lai and Z. Lin, Separation Science and Technology, 2002: 847–875) describes an experiment involving a chemical process designed to separate enantiomers. A model was fit to estimate the cycle time (y) in terms of the flow rate (x1), sample concentration (x2), and mobile-phase composition (x3). The results of a least-squares fit are presented in the following table. (The article did not provide the value of the t statistic for the constant term.) Predictor Coefficient т Constant 1.603 X1 -0.619 -22.289 0.000 X2 0.086 3.084 0.018 0.306 11.011 0.000 0.272 8.542 0.000 0.057 1.802 0.115 0.105 3.300 0.013 X1X2 -0.022 -0.630 0.549 XXз -0.036 -1.004 0.349 X>Xз 0.036 1.018 0.343 Of the following, which is the best next step in the analysis? i. Nothing needs to be done. This model is fine. Drop x;, x;, and x from the model, and then perform an F test. iii. Drop x1x2, X1X3,and x2x3 from the model, and then perform an F test. iv. Drop x, and x; from the model, and then perform an F test. Add cubic terms x, x, and x} to the model to try to improve the fit. ii. V.

MATLAB: An Introduction with Applications
6th Edition
ISBN:9781119256830
Author:Amos Gilat
Publisher:Amos Gilat
Chapter1: Starting With Matlab
Section: Chapter Questions
Problem 1P

Related questions
Question
Transcribed Image Text:The article "Experimental Design Approach for the Optimization of the Separation of
Enantiomers in Preparative Liquid Chromatography" (S. Lai and Z. Lin, Separation Science
and Technology, 2002: 847–875) describes an experiment involving a chemical process
designed to separate enantiomers. A model was fit to estimate the cycle time (y) in terms of
the flow rate (x1), sample concentration (x2), and mobile-phase composition (x3). The results
of a least-squares fit are presented in the following table. (The article did not provide the
value of the t statistic for the constant term.)
Predictor
Coefficient
т
Constant
1.603
X1
-0.619
-22.289
0.000
X2
0.086
3.084
0.018
0.306
11.011
0.000
0.272
8.542
0.000
0.057
1.802
0.115
0.105
3.300
0.013
X1X2
-0.022
-0.630
0.549
XXз
-0.036
-1.004
0.349
X>Xз
0.036
1.018
0.343
Of the following, which is the best next step in the analysis?
i.
Nothing needs to be done. This model is fine.
Drop x;, x;, and x from the model, and then perform an F test.
iii. Drop x1x2, X1X3,and x2x3 from the model, and then perform an F test.
iv. Drop x, and x; from the model, and then perform an F test.
Add cubic terms x, x, and x} to the model to try to improve the fit.
ii.
V.
Expert Solution
This question has been solved!
Explore an expertly crafted, step-by-step solution for a thorough understanding of key concepts.

This is a popular solution!

Trending now
This is a popular solution!

Step by step
Solved in 2 steps

Recommended textbooks for you
MATLAB: An Introduction with Applications
Statistics
ISBN:
9781119256830
Author:
Amos Gilat
Publisher:
John Wiley & Sons Inc

Probability and Statistics for Engineering and th…
Statistics
ISBN:
9781305251809
Author:
Jay L. Devore
Publisher:
Cengage Learning

Statistics for The Behavioral Sciences (MindTap C…
Statistics
ISBN:
9781305504912
Author:
Frederick J Gravetter, Larry B. Wallnau
Publisher:
Cengage Learning
MATLAB: An Introduction with Applications
Statistics
ISBN:
9781119256830
Author:
Amos Gilat
Publisher:
John Wiley & Sons Inc
Probability and Statistics for Engineering and th…
Statistics
ISBN:
9781305251809
Author:
Jay L. Devore
Publisher:
Cengage Learning
Statistics for The Behavioral Sciences (MindTap C…
Statistics
ISBN:
9781305504912
Author:
Frederick J Gravetter, Larry B. Wallnau
Publisher:
Cengage Learning

Elementary Statistics: Picturing the World (7th E…
Statistics
ISBN:
9780134683416
Author:
Ron Larson, Betsy Farber
Publisher:
PEARSON

The Basic Practice of Statistics
Statistics
ISBN:
9781319042578
Author:
David S. Moore, William I. Notz, Michael A. Fligner
Publisher:
W. H. Freeman

Introduction to the Practice of Statistics
Statistics
ISBN:
9781319013387
Author:
David S. Moore, George P. McCabe, Bruce A. Craig
Publisher:
W. H. Freeman