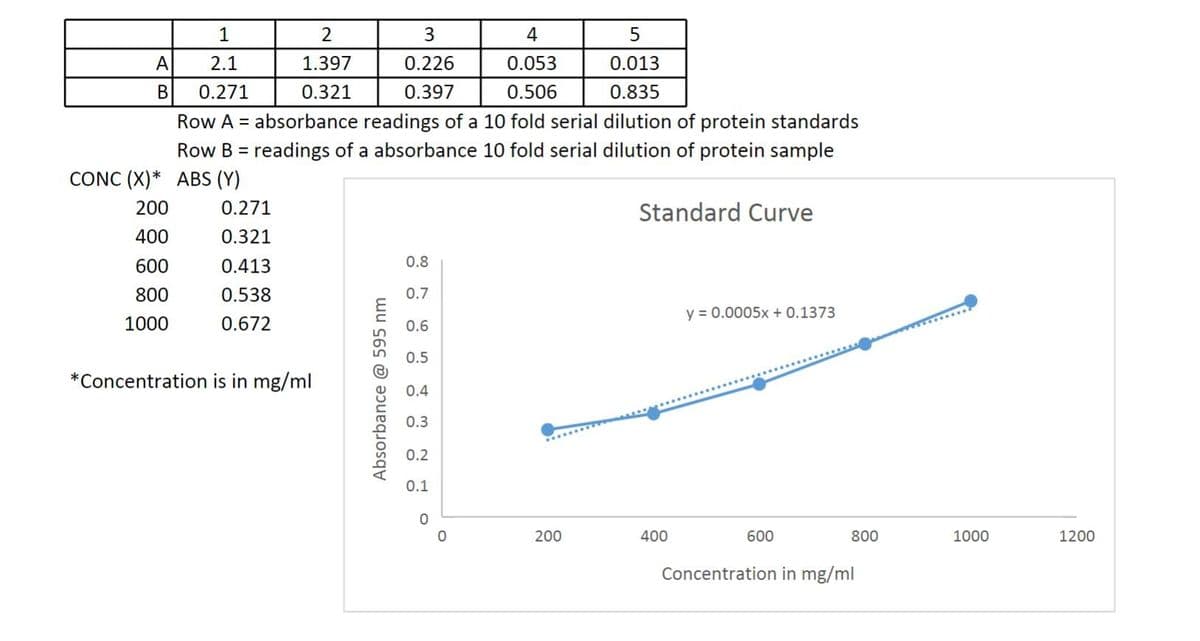
The chart below represents the results (absorbance readings) of your Bradford Assay. Use the data and graph to determine the dilution of each well and concentration (in mg/ml) of the sample in each well of the microtiter plate.


Q: You have performed a serial dilution of an unknown sample and counted 73 CFU on a countable plate…
A: Serial dilution is method of diluting a bacterial culture in succession. The process reduces the…
Q: Using a pipette, add 2 mL of suspended DEAE SEPHAROSE (anion) resin to a chromatographic column.…
A: DEAE Sepharose matrix is used in Anion exchange column. In the given method power of salt strength…
Q: Explain why only gram-negative cells undergo decolorization during the gram staining procedure.
A: Gram staining is a method in which cells stain either pink (gram-negative) or purple (gram-positive)…
Q: What is this test? What coated the bottom of the wells? What were we testing for? How did we know it…
A: The test is ELISA. It is an Enzyme linked Immunosorbant Assay, which is used in many applications.…
Q: The table below summarizes the experimental results obtained from test performed on two types of…
A: IODINE TEST : The iodine test is a chemical reaction that is used to test for the presence of starch…
Q: If 0.1 ml is added to 99.9 ml medium, this results in a dilution of: Select one: а. 10-3 b. 10-4 С.…
A: Dilution is a process of decreasing the concentration of solute present in a solution. Dilution is…
Q: gel filtration chromatography using a column experiment.
A: Introduction Gel-filtration chromatography is a type of parcel chromatography used to isolate…
Q: Flame Test (Unknown) View the Unknowns to see the results of the flame test. Record Your…
A: As per our honor code, we are not allowed to give you a handwritten solution, however here is the…
Q: What are the advantages and disadvantages of the filter method in the analysis of water samples?
A: Utilising the membrane filter method, test is gone through the layer utilising a filter funnel and…
Q: In a Kligler Iron Agar/Triple Sugar Iron test you end up with a result with a yellow butt and red…
A: When a non-lactose fermenting bacterium hydrolyses the agar slant in the Kliger Iron Agar/ Triple…
Q: How would you identify this unknown bacteria using a flowchart and the bacteria below as a possible…
A: Biochemical tests in Microbiology help in distinguishing and identifying bacteria. Through the…
Q: Make a viable count of the donor culture by spot inoculation of he nutrient agar plate WITHOUT…
A: Nutrient agar is generally preapared for the bacterial growth to carry out biochemical reations on…
Q: The following are errors that people commonly make when they perform serial dilutions. Indicate…
A: The mechanism of dilution of a substance present in a solution is known as serial dilution. The…
Q: Practical techniques used to identify unknown microorganisms’ You should include the types of tests…
A: Microbiology is the study of microorganisms, identification, and classification of a particular…
Q: For an In vitro mimicking infection test:
A: Introduction: Cell culture is the process of growing cells in a controlled setting, usually outside…
Q: After finishing running IEX on HPLC, you found out that the detector on HPLC was not on during…
A: An extracted-ion chromatogram is generated by separating the ions of interest from a data file…
Q: You are testing unpasteurized milk for the presence of bacterial contamination. Starting from the…
A:
Q: Give at least two other examples of samples that are best prepared using Smear Preparation…
A: Smear preparation technique: it is used to fix the samples onto the slides.
Q: A tampered sack of powdered milk was analyzed by getting 50 grams of composited sample and diluting…
A: Dilution : We know that the solute of the concentration will be decreasing in solution . There is a…
Q: Given: The used ocular objective while taking this image, has magnifying power of 6x The used…
A: The microscope is an instrument used to see objects that are too small where enlarges the image of…
Q: To determine the cfu/ml of a pondwater sample, you perform 1/10, 1/100, 1/1000 and 1/10,000 serial…
A: Serial dilution is a technique which is adopted to dilute the highly concentrated microbial culture…
Q: For his experiment, Brian needs to prepare 30 plates (use maximum volume), 15 slants (small test…
A: In order for the microorganisms to survive and grow under laboratory conditions we need to provide…
Q: Which of the following is true Select one: O a. Inoculating loop and needle are culture equipment…
A: Answer: CULTURE MEDIA = These are the microbiological culture which are used for the bacterial…
Q: The following figures are the photomicrographs of the samples taken with Kern&Sohn Camera Microscope…
A: Ans: Lugols solution: The Lugols solution is 2.5 to 25% weight by volume total iodine.
Q: The absorbance of light is measured with a spectrophotometer and the result can be used to estimate…
A: the absorbance of light is measured with a spectrophotometer and result can be used to estimate the…
Q: Complete the following table summarising the neutral red assay data from the group following…
A: Cell Viability Assays -- It is a measure of the proportion of healthy , live cells with in a…
Q: Given: The used ocular objective while taking this image, has magnifying power of 6x The used…
A: Magnification on a microscope denotes the amount or degree of visual enlargement of an observed…
Q: What is the importance of the Nitrate test? What information can we gather from this test? Please…
A: Nitrate broth used in the nitrate test contains nutrients and potassium nitrate as a source of…
Q: Give the drug examples of emulsion prepare by these method:- 1)dry gum method 2)wet gum method…
A: Emulsions are heterogeneous biphasic systems. Thus, there are two immiscible phases. One of the…
Q: the image contains results of the fluid thioglycolate medium tests. Please explain the results and…
A: Fluid thioglycolate medium test It is a multipurpose and enriched test. It is a differential medium…
Q: With the constants you have for each objective, compute for the sizes of the given cells below.…
A: As we know that cell is the structural and functional unit of life it performing all the essential…
Q: A sample of pond water is tested using the most probable number method. There are 3 positive tubes…
A: Given , 10 mL - 3 positive tube 1 mL - 1 positive tube 0.1 mL - 1 positive tube
Q: True or False: Ultrathin sections are used for light microscopy but are to thin to be stable under…
A: Microscopes are used to visualize objects that are not visible to the naked eye. In microbiology,…
Q: Answer the following questions (not more than 5 sentences/question). Discuss the correct…
A: Qualitative analysis is the process of identification and detection of elements or groups of…
Q: CFU/mL
A: in calculation via conventional formula , CFUs/ml in 2nd dilution are greater than 1st dilution…
Q: The figure above depicts an agar cube with a side length of 13\, \text{mm}13mm13, start text, m, m,…
A: The interior, unpenetrated region of the agar cube is also cube-shaped because the orange dye…
Q: list the reagents used in the IMViC tests and what they detect
A: IMViC is a series of tests that include the indole test, methyl red test, Voges-Proskauer test, and…
Q: After placing sample in this instrument, what are the names of two fractions in the tube (choose all…
A: Centrifugation is the process by which components of a solution are separated from one another based…
Q: at is the wavelength of maximum aborbance for the Bradford reagent in its blue form. at is the…
A: Bradford reagent in Bradford assay is used to to assess the amount of protein in a sample. The…
Q: You are asked to calibrate the ocular micrometer for the 4x objective using the stage micrometer.…
A: Length of stage micrometer is 1mm with 100 divisions ,so each division is of size one-hundredth of…
Q: Why is it important to get the right amount of stool sample to be smeared for microscopic assessment…
A: A stool analysis is a series of tests performed on a stool (faeces) sample to aid in the diagnosis…
Q: Vol to transfer: ml ml ml ml Overnight culture
A: Serial dilution is a method used to decrease the concentration of a sample sequentially . During…
Q: You can perform a specific staining method to confirm the purity on the culture. Describe this…
A: Microscopic samples are generally stained prior to analysis as it enhances their contrast and aids…
Q: You discover that the plate you selected had only been inoculated with 0.1 ML of the dilution…
A: The CFU corresponds to the Colony forming units which is the unit used to estimate the number of…
Q: After a urine culture, 95 colonies are counted on a plate inoculated with 1 uL of urine samplpe.…
A: The CFU count gives us the viable number of cells present in the sample.
Q: Three sugars (Sugar A, Band C) were applied to a line as part of the set-up of a Paper…
A: Paper chromatography is the basic technique to separate dissolved chemical substances from the…
Q: Explain each type of anti-fouling system (application and procedure) Electrolytic system Chemical…
A: Anti fouling is a coating which can be done on the hull of any ship It prevents the overgrowth of…
Q: The functions of the loading dye are: (select all that apply) | to prevent sample degradation as gel…
A: It is a mixture of certain chemicals and the chemical composition differ from dye to dye depending…
Q: Provide the Experimental procedure of the following: Example: Ninhydrin Test -The samples needed…
A: There are many tests that are used for distinguishing the different samples of proteins in the…
The chart below represents the results (absorbance readings) of your Bradford Assay. Use the data and graph to determine the dilution of each well and concentration (in mg/ml) of the sample in each well of the microtiter plate.

Step by step
Solved in 2 steps

- You obtained the following raw data when setting up a Bradford standard curve: BSA (mg/ml) Absorbancy 595nm 0 0.225 1 0.310 2 0.420 3 0.510 4 0.610 5 0.720 6 0.810 7 0.915 8 0.950 9 0.980 10 0.990 After blanking against a bradford-dH2O sample, the protein concentration of an unknown sample was determined using the same method and an absorbancy of 0.570 was obtained. Set up a standard curve, excluding outliers (experimental and statistical) and determine the protein concentration in the unknown sample in mg / ml (up to 3 significant figures).You obtained the following raw data when setting up a Biuret standard curve: BSA (mg/ml) Absorbancy 540nm 0 0.158 1 0.210 2 0.260 3 0.305 4 0.360 5 0.410 6 0.455 7 0.510 8 0.530 9 0.550 10 0.554 After blanking against a biuret-dH2O sample, the protein concentration of an unknown sample was determined using the same method and an absorbancy of 0.284 was obtained. Set up a standard curve, excluding outliers (experimental and statistical) and determine the protein concentration in the unknown sample in mg / ml (up to 3 significant figures).The following protein quantification utilizes Cu ions except fora. Lowryb. Biuretc.Bradford
- The following table provides data on three popular protein supplements. (Figures shown correspond to a single serving.) Protein (g) Carbohydrates (g) Sodium (mg) Cost ($) Designer Whey(Designer Protein) 20 6 90 0.80 Muscle Milk(Cytosport) 16 10 80 0.90 100%Whey Gold Standard(Optimum Nutrition) 24 3 210 1.00 You are thinking of combining Designer Whey and Muscle Milk to obtain a 3-day supply that provides exactly 200 grams of protein and 86 grams of carbohydrates. How many servings of each supplement should you combine in order to meet your requirements? Designer Whey _____servings Muscle Milk ______servings What will it cost? _______Given the following information, calculate the total activity in the undiluted protein sample. Activity of 1 ml of diluted sample = 0.5 Total volume of sample = 5 ml Dilution factor = 10 25 50.5 250 2.5Calculate protein concentration in unknown samples 1, 2, 3: Absorbance of Unknown 1 = 0.541 Absorbance of Unknown 2 = 0.85 Absorbance of Unknown 3 = 1.02 Standard Curve: Y = 0.0073x
- Using the data from the standard curve done previously, you record the absorbance of your extracted milk protein sample at 0.499 at 540nm. What is the mass of the protein in mg assuming you collected 10mL worth of the protein? Your standard curve should have a line of best fit with the equation y=0.0001x+0.0038.Using Bradford Assay, plot the standard curve and find the unknowns. Protein Concentration A595 of sample 0 0 3 0.220 6.5 0.383 12 0.667 18.8 0.930 24.2 1.090 Unknown 1 1.085 Unknown 2 0.708 Unknown 3 0.193If I had a standard with 2.0 mL of Bradford reagent then added 50μL of 250 μL/mL ; what would be the concentration of original protein?
- Given the Ramachandran Plot below, identify the protein components that could adopt the phi-psi angle combination indicated by the number 3.If a pediatric vitamin contains 1500 units of vitamin A per milliliter of solution, how many units of vitamin A would be administered to a child given 2 drops of a solution from a drpper calibrated to deliver 20 drops per milliar of solution?What is the approximate rate of change of A340 measured? i.e. ΔA340 / min = __________ What rate of change of A340 would you predict if 30 ml of the ADH solution was tested in the same way (i.e. half the amount of protein) ? i.e. ΔA340 / min = __________ What rate of change of A340 would you predict if 60 ml of a 0.5 μM ADH solution was tested in the same way? i.e. ΔA340 / min = __________ As well as writing your answers, explain your reasoning.