The data in the table represent the number of licensed drivers in various age groups and the number of fatal accidents within the age group by gender. Complete parts (a) through (c) below. O Click the icon to view the data table. (a) Find the least-squares regression line for males treating the number of licensed drivers as the explanatory variable, x, and the number of fatal crashes, y, as the response variable. Repeat this procedure for females. Find the least-squares regression line for males. Data for licensed drivers by age and gender. (Round the x coefficient to three decimal places as needed. Round the constant to the nearest integer as needed.) Find the least-squares regression line for females. Number of Number Number of Male Fatal (Round the x coefficient to three decimal places as needed. Round the constant to the nearest integer as needed.) Number of Female Fatal Licensed Drivers (000s) Licensed Drivers Crashes Crashes (b) Interpret the slope of the least-squares regression line for each gender, if appropriate. How might an insurance company use this information? Age (000s) (Male) (Female) < 16 12 227 12 77 What is the correct interpretation of the slope of the least-squares regression line for males? Select the correct choice below and, if necessary, fill in the answer box to complete your (Use the answer from part a to find this answer.) 16-20 6,424 6,973 5,180 6,139 6,816 17,664 20,077 19,984 2,113 21-24 5,016 1,521 O A. If the average age of all male licensed drivers increases by 1, then the number of fatal crashes increases by. on average. O B. If the number of male licensed drivers increases by 1 (thousand), then the number of fatal crashes increases by, on average. 25-34 18,068 8,540 2,780 35-44 20,406 7,990 2,742 45-54 19,898 7,111 2,285 14,441 8,405 O C. If the number of fatal crashes increases by 1, then the number of male licensed drivers increases by thousand, on average. 55-64 14,353 4,527 1,514 65-74 8,194 2,274 938 O D. It does not make sense to interpret the slope. >74 4,803 2,022 5,375 969 What is the correct interpretation of the slope of the least-squares regression line for females? Select the correct choice below and, if necessary, fill in the answer box to complete you (Use the answer from part a to find this answer.) O A. If the average age of all female licensed drivers increases by 1, then the number of fatal crashes increases by, on average. Print Done O B. If the number of female licensed drivers increases by 1 (thousand), then the number of fatal crashes increases by, on average. O C. If the number of fatal crashes increases by 1, then the number of female licensed drivers increases by thousand, on average. O D. It does not make sense to interpret the slope.
The data in the table represent the number of licensed drivers in various age groups and the number of fatal accidents within the age group by gender. Complete parts (a) through (c) below. O Click the icon to view the data table. (a) Find the least-squares regression line for males treating the number of licensed drivers as the explanatory variable, x, and the number of fatal crashes, y, as the response variable. Repeat this procedure for females. Find the least-squares regression line for males. Data for licensed drivers by age and gender. (Round the x coefficient to three decimal places as needed. Round the constant to the nearest integer as needed.) Find the least-squares regression line for females. Number of Number Number of Male Fatal (Round the x coefficient to three decimal places as needed. Round the constant to the nearest integer as needed.) Number of Female Fatal Licensed Drivers (000s) Licensed Drivers Crashes Crashes (b) Interpret the slope of the least-squares regression line for each gender, if appropriate. How might an insurance company use this information? Age (000s) (Male) (Female) < 16 12 227 12 77 What is the correct interpretation of the slope of the least-squares regression line for males? Select the correct choice below and, if necessary, fill in the answer box to complete your (Use the answer from part a to find this answer.) 16-20 6,424 6,973 5,180 6,139 6,816 17,664 20,077 19,984 2,113 21-24 5,016 1,521 O A. If the average age of all male licensed drivers increases by 1, then the number of fatal crashes increases by. on average. O B. If the number of male licensed drivers increases by 1 (thousand), then the number of fatal crashes increases by, on average. 25-34 18,068 8,540 2,780 35-44 20,406 7,990 2,742 45-54 19,898 7,111 2,285 14,441 8,405 O C. If the number of fatal crashes increases by 1, then the number of male licensed drivers increases by thousand, on average. 55-64 14,353 4,527 1,514 65-74 8,194 2,274 938 O D. It does not make sense to interpret the slope. >74 4,803 2,022 5,375 969 What is the correct interpretation of the slope of the least-squares regression line for females? Select the correct choice below and, if necessary, fill in the answer box to complete you (Use the answer from part a to find this answer.) O A. If the average age of all female licensed drivers increases by 1, then the number of fatal crashes increases by, on average. Print Done O B. If the number of female licensed drivers increases by 1 (thousand), then the number of fatal crashes increases by, on average. O C. If the number of fatal crashes increases by 1, then the number of female licensed drivers increases by thousand, on average. O D. It does not make sense to interpret the slope.

Elementary Linear Algebra (MindTap Course List)
8th Edition
ISBN:9781305658004
Author:Ron Larson
Publisher:Ron Larson
Chapter2: Matrices
Section2.CR: Review Exercises
Problem 90CR

Related questions
Question
Practice Pack
Transcribed Image Text:The data in the table represent the number of licensed drivers in various age groups and the number of fatal accidents within the age group by gender. Complete parts (a) through (c) below.
Click the icon to view the data table.
... .
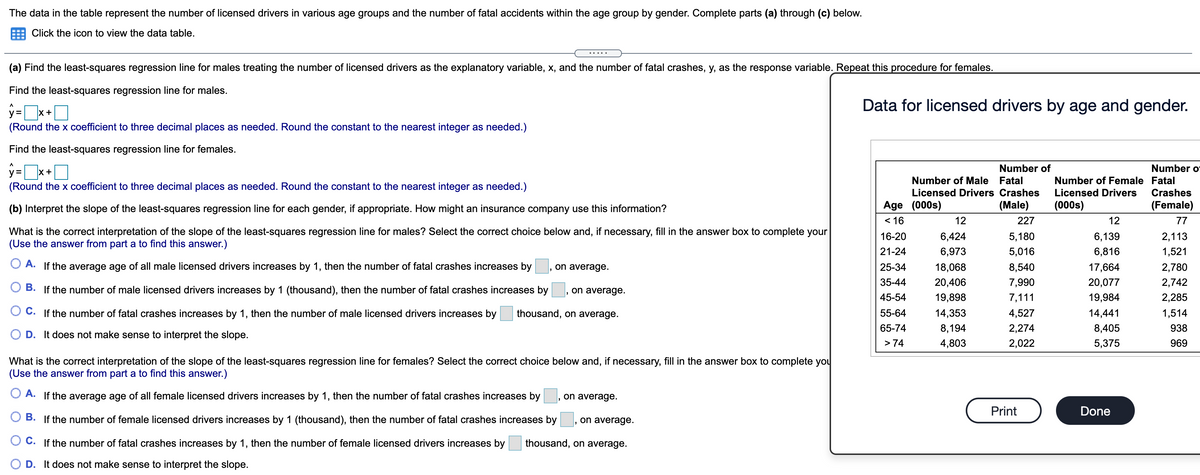
(a) Find the least-squares regression line for males treating the number of licensed drivers as the explanatory variable, x, and the number of fatal crashes, y, as the response variable. Repeat this procedure for females.
Find the least-squares regression line for males.
y=x+O
Data for licensed drivers by age and gender.
%3D
(Round the x coefficient to three decimal places as needed. Round the constant to the nearest integer as needed.)
Find the least-squares regression line for females.
y =
Number of
Number o
X+
Number of Male Fatal
Number of Female Fatal
(Round the x coefficient to three decimal places as needed. Round the constant to the nearest integer as needed.)
Licensed Drivers Crashes
Licensed Drivers
Crashes
(b) Interpret the slope of the least-squares regression line for each gender, if appropriate. How might an insurance company use this information?
Age (000s)
(Male)
(000s)
(Female)
< 16
12
227
12
77
What is the correct interpretation of the slope of the least-squares regression line for males? Select the correct choice below and, if necessary, fill in the answer box to complete your
(Use the answer from part a to find this answer.)
16-20
6,424
5,180
6,139
2,113
21-24
6,973
5,016
6,816
1,521
O A. If the average age of all male licensed drivers increases by 1, then the number of fatal crashes increases by
on average.
25-34
18,068
8,540
17,664
2,780
35-44
20,406
7,990
20,077
2,742
B. If the number of male licensed drivers increases by 1 (thousand), then the number of fatal crashes increases by
on average.
45-54
19,898
7,111
19,984
2,285
О с.
the
mber
fatal crashes increases by 1, then the
mber of m
licensed drivers increases by
thousand, on average.
55-64
14
4,527
14,441
1,514
65-74
8,194
2,274
8,405
938
O D. It does not make sense to interpret the slope.
> 74
4,803
2,022
5,375
969
What is the correct interpretation of the slope of the least-squares regression line for females? Select the correct choice below and, if necessary, fill in the answer box to complete you
(Use the answer from part a to find this answer.)
O A. If the average age of all female licensed drivers increases by 1, then the number of fatal crashes increases by
on average.
Print
Done
B. If the number of female licensed drivers increases by 1 (thousand), then the number of fatal crashes increases by
on average.
C. If the number of fatal crashes increases by 1, then the number of female licensed drivers increases by
thousand, on average.
D. It does not make sense to interpret the slope.
Expert Solution
This question has been solved!
Explore an expertly crafted, step-by-step solution for a thorough understanding of key concepts.

This is a popular solution!

Includes step-by-step video

Trending now
This is a popular solution!

Learn your way
Includes step-by-step video

Step by step
Solved in 3 steps with 4 images

Recommended textbooks for you
Elementary Linear Algebra (MindTap Course List)
Algebra
ISBN:
9781305658004
Author:
Ron Larson
Publisher:
Cengage Learning

Linear Algebra: A Modern Introduction
Algebra
ISBN:
9781285463247
Author:
David Poole
Publisher:
Cengage Learning

Glencoe Algebra 1, Student Edition, 9780079039897…
Algebra
ISBN:
9780079039897
Author:
Carter
Publisher:
McGraw Hill
Elementary Linear Algebra (MindTap Course List)
Algebra
ISBN:
9781305658004
Author:
Ron Larson
Publisher:
Cengage Learning
Linear Algebra: A Modern Introduction
Algebra
ISBN:
9781285463247
Author:
David Poole
Publisher:
Cengage Learning
Glencoe Algebra 1, Student Edition, 9780079039897…
Algebra
ISBN:
9780079039897
Author:
Carter
Publisher:
McGraw Hill