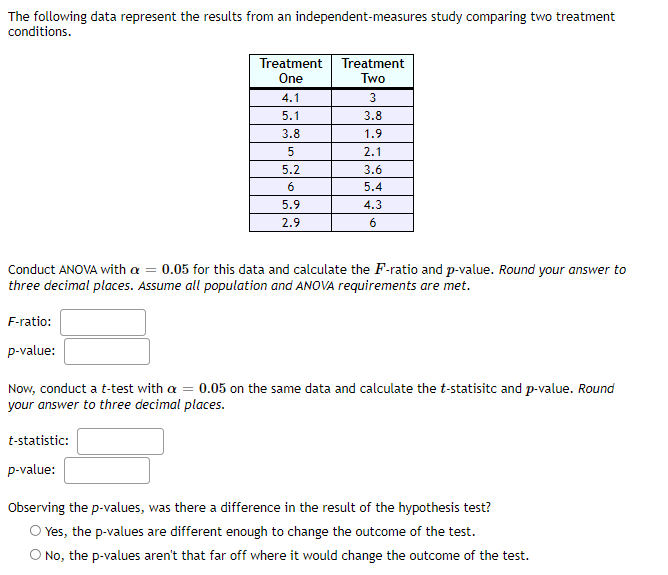
The following data represent the results from an independent-measures study comparing two treatment conditions. Treatment Treatment One Two 4.1 3 5.1 3.8 3.8 1.9 2.1 5.2 3.6 6 5.4 5.9 4.3 2.9 6 Conduct ANOVA with a = 0.05 for this data and calculate the F-ratio and p-value. Round your answer to three decimal places. Assume all population and ANOVA requirements are met. F-ratio: p-value: Now, conduct a t-test with a = 0.05 on the same data and calculate the t-statisitc and p-value. Round your answer to three decimal places. t-statistic: p-value: Observing the p-values, was there a difference in the result of the hypothesis test? O Yes, the p-values are different enough to change the outcome of the test. O No, the p-values aren't that far off where it would change the outcome of the test.
The following data represent the results from an independent-measures study comparing two treatment conditions. Treatment Treatment One Two 4.1 3 5.1 3.8 3.8 1.9 2.1 5.2 3.6 6 5.4 5.9 4.3 2.9 6 Conduct ANOVA with a = 0.05 for this data and calculate the F-ratio and p-value. Round your answer to three decimal places. Assume all population and ANOVA requirements are met. F-ratio: p-value: Now, conduct a t-test with a = 0.05 on the same data and calculate the t-statisitc and p-value. Round your answer to three decimal places. t-statistic: p-value: Observing the p-values, was there a difference in the result of the hypothesis test? O Yes, the p-values are different enough to change the outcome of the test. O No, the p-values aren't that far off where it would change the outcome of the test.

MATLAB: An Introduction with Applications
6th Edition
ISBN:9781119256830
Author:Amos Gilat
Publisher:Amos Gilat
Chapter1: Starting With Matlab
Section: Chapter Questions
Problem 1P

Related questions
Question
Transcribed Image Text:The following data represent the results from an independent-measures study comparing two treatment
conditions.
Treatment
One
Treatment
Two
4.1
5.1
3.8
3.8
1.9
2.1
5.2
3.6
5.4
5.9
4.3
2.9
Conduct ANOVA with a = 0.05 for this data and calculate the F-ratio and p-value. Round your answer to
three decimal places. Assume all population and ANOVA requirements are met.
F-ratio:
p-value:
Now, conduct a t-test with a = 0.05 on the same data and calculate the t-statisitc and p-value. Round
your answer to three decimal places.
t-statistic:
p-value:
Observing the p-values, was there a difference in the result of the hypothesis test?
O Yes, the p-values are different enough to change the outcome of the test.
O No, the p-values aren't that far off where it would change the outcome of the test.
Expert Solution
This question has been solved!
Explore an expertly crafted, step-by-step solution for a thorough understanding of key concepts.

Step by step
Solved in 4 steps with 2 images

Recommended textbooks for you
MATLAB: An Introduction with Applications
Statistics
ISBN:
9781119256830
Author:
Amos Gilat
Publisher:
John Wiley & Sons Inc

Probability and Statistics for Engineering and th…
Statistics
ISBN:
9781305251809
Author:
Jay L. Devore
Publisher:
Cengage Learning

Statistics for The Behavioral Sciences (MindTap C…
Statistics
ISBN:
9781305504912
Author:
Frederick J Gravetter, Larry B. Wallnau
Publisher:
Cengage Learning
MATLAB: An Introduction with Applications
Statistics
ISBN:
9781119256830
Author:
Amos Gilat
Publisher:
John Wiley & Sons Inc
Probability and Statistics for Engineering and th…
Statistics
ISBN:
9781305251809
Author:
Jay L. Devore
Publisher:
Cengage Learning
Statistics for The Behavioral Sciences (MindTap C…
Statistics
ISBN:
9781305504912
Author:
Frederick J Gravetter, Larry B. Wallnau
Publisher:
Cengage Learning

Elementary Statistics: Picturing the World (7th E…
Statistics
ISBN:
9780134683416
Author:
Ron Larson, Betsy Farber
Publisher:
PEARSON

The Basic Practice of Statistics
Statistics
ISBN:
9781319042578
Author:
David S. Moore, William I. Notz, Michael A. Fligner
Publisher:
W. H. Freeman

Introduction to the Practice of Statistics
Statistics
ISBN:
9781319013387
Author:
David S. Moore, George P. McCabe, Bruce A. Craig
Publisher:
W. H. Freeman