The following gives the number of accidents that occurred on Florida State Highway 101 during the last 4 months: Month Jan Feb Mar Apr Number of Accidents 25 45 60 105 Using the least-squares regression method, the trend equation for forecasting is (round your responses to two decimal places): y = -5 + 25.5 x Using least-squares regression, the forecast for the number of accidents that will occur in the month of May = 122.5 accidents (enter your response as a whole number).
The following gives the number of accidents that occurred on Florida State Highway 101 during the last 4 months: Month Jan Feb Mar Apr Number of Accidents 25 45 60 105 Using the least-squares regression method, the trend equation for forecasting is (round your responses to two decimal places): y = -5 + 25.5 x Using least-squares regression, the forecast for the number of accidents that will occur in the month of May = 122.5 accidents (enter your response as a whole number).

Practical Management Science
6th Edition
ISBN:9781337406659
Author:WINSTON, Wayne L.
Publisher:WINSTON, Wayne L.
Chapter13: Regression And Forecasting Models
Section13.7: Exponential Smoothing Models
Problem 25P: The file P13_25.xlsx contains the quarterly numbers of applications for home mortgage loans at a...

Related questions
Question
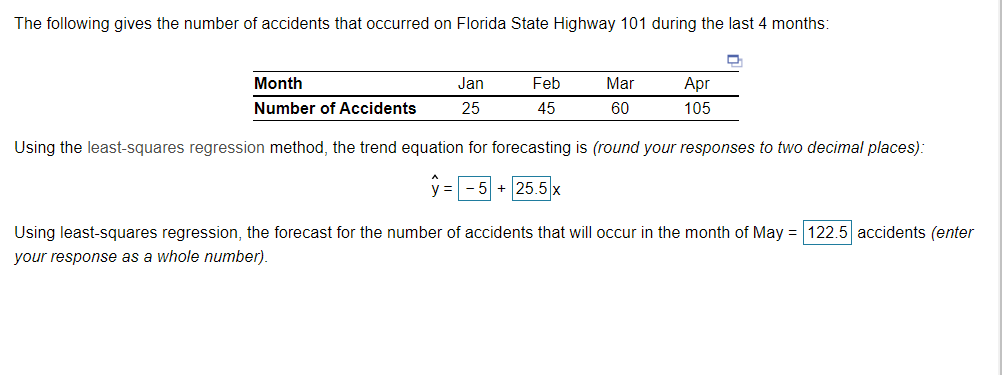
Transcribed Image Text:The following gives the number of accidents that occurred on Florida State Highway 101 during the last 4 months:
Month
Jan
Feb
Mar
Apr
Number of Accidents
25
45
60
105
Using the least-squares regression method, the trend equation for forecasting is (round your responses to two decimal places):
y = - 5 + 25.5 x
Using least-squares regression, the forecast for the number of accidents that will occur in the month of May = 122.5 accidents (enter
your response as a whole number).
Expert Solution
This question has been solved!
Explore an expertly crafted, step-by-step solution for a thorough understanding of key concepts.

This is a popular solution!

Trending now
This is a popular solution!

Step by step
Solved in 2 steps with 1 images

Recommended textbooks for you
Practical Management Science
Operations Management
ISBN:
9781337406659
Author:
WINSTON, Wayne L.
Publisher:
Cengage,

Contemporary Marketing
Marketing
ISBN:
9780357033777
Author:
Louis E. Boone, David L. Kurtz
Publisher:
Cengage Learning

Marketing
Marketing
ISBN:
9780357033791
Author:
Pride, William M
Publisher:
South Western Educational Publishing
Practical Management Science
Operations Management
ISBN:
9781337406659
Author:
WINSTON, Wayne L.
Publisher:
Cengage,
Contemporary Marketing
Marketing
ISBN:
9780357033777
Author:
Louis E. Boone, David L. Kurtz
Publisher:
Cengage Learning
Marketing
Marketing
ISBN:
9780357033791
Author:
Pride, William M
Publisher:
South Western Educational Publishing