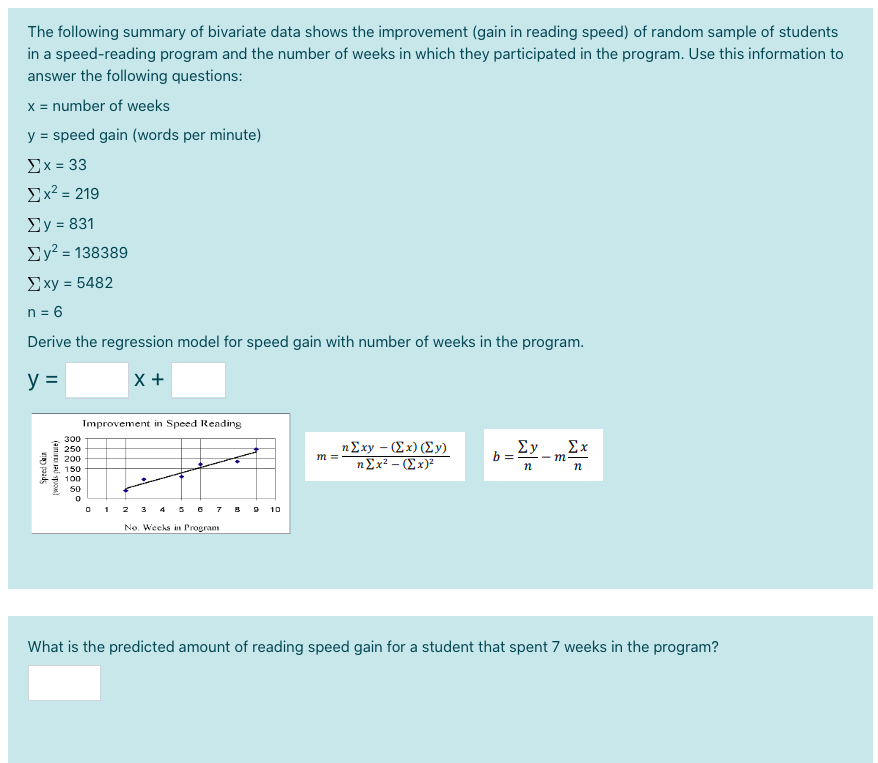
The following summary of bivariate data shows the improvement (gain in reading speed) of random sample of students in a speed-reading program and the number of weeks in which they participated in the program. Use this information t answer the following questions: x = number of weeks y = speed gain (words per minute) %3D Σx= 3 Σχ219 Σy= 831 Ey? = 138389 Exy = 5482 n = 6 Derive the regression model for speed gain with number of weeks in the program. y = x + Improvement in Speed Reading 300 η Σxy-Σx) (Σy) nEx² – (Ex)² ΣyΣx b 250 m = m n 200 2 150 100 50 4 5 6 7 BD 10 No. Weeks in Program What is the predicted amount of reading speed gain for a student that spent 7 weeks in the program? Spred Cain (am ad spom)


Correlation
Correlation defines a relationship between two independent variables. It tells the degree to which variables move in relation to each other. When two sets of data are related to each other, there is a correlation between them.
Linear Correlation
A correlation is used to determine the relationships between numerical and categorical variables. In other words, it is an indicator of how things are connected to one another. The correlation analysis is the study of how variables are related.
Regression Analysis
Regression analysis is a statistical method in which it estimates the relationship between a dependent variable and one or more independent variable. In simple terms dependent variable is called as outcome variable and independent variable is called as predictors. Regression analysis is one of the methods to find the trends in data. The independent variable used in Regression analysis is named Predictor variable. It offers data of an associated dependent variable regarding a particular outcome.


Trending now
This is a popular solution!

Step by step
Solved in 3 steps


