The following table contains observed frequencies for a sample of 200. Column Variable Row Variable A 22 46 52 28 24 28 Test for independence of the row and column variables using a = 0.05. State the null and alternative hypotheses. O Ho: The column variable is not independent of the row variable. H: The column variable is independent of the row variable. O Ho: Variable P is not independent of variable Q. H: Variable P is independent of variable Q. O Ho: Variable P is independent of variable Q. H: Variable P is not independent of variable Q. O Ho: The column variable is independent of the row variable. H: The column variable is not independent of the row variable. Find the value of the test statistic. (Round your answer to three decimal places.) Find the p-value. (Round your answer to four decimal places.) p-value = State your conclusion. O Do not reject Ho. We cannot conclude that there is an association between the column variable and the row variable. O Do not reject Ha. We cannot conclude that the column and row variables are independent. O Reject H. We conclude that there is an association between the column variable and the row variable. O Reject Ha. We conclude that the column and row variables are independent.
The following table contains observed frequencies for a sample of 200. Column Variable Row Variable A 22 46 52 28 24 28 Test for independence of the row and column variables using a = 0.05. State the null and alternative hypotheses. O Ho: The column variable is not independent of the row variable. H: The column variable is independent of the row variable. O Ho: Variable P is not independent of variable Q. H: Variable P is independent of variable Q. O Ho: Variable P is independent of variable Q. H: Variable P is not independent of variable Q. O Ho: The column variable is independent of the row variable. H: The column variable is not independent of the row variable. Find the value of the test statistic. (Round your answer to three decimal places.) Find the p-value. (Round your answer to four decimal places.) p-value = State your conclusion. O Do not reject Ho. We cannot conclude that there is an association between the column variable and the row variable. O Do not reject Ha. We cannot conclude that the column and row variables are independent. O Reject H. We conclude that there is an association between the column variable and the row variable. O Reject Ha. We conclude that the column and row variables are independent.

MATLAB: An Introduction with Applications
6th Edition
ISBN:9781119256830
Author:Amos Gilat
Publisher:Amos Gilat
Chapter1: Starting With Matlab
Section: Chapter Questions
Problem 1P

Related questions
Question
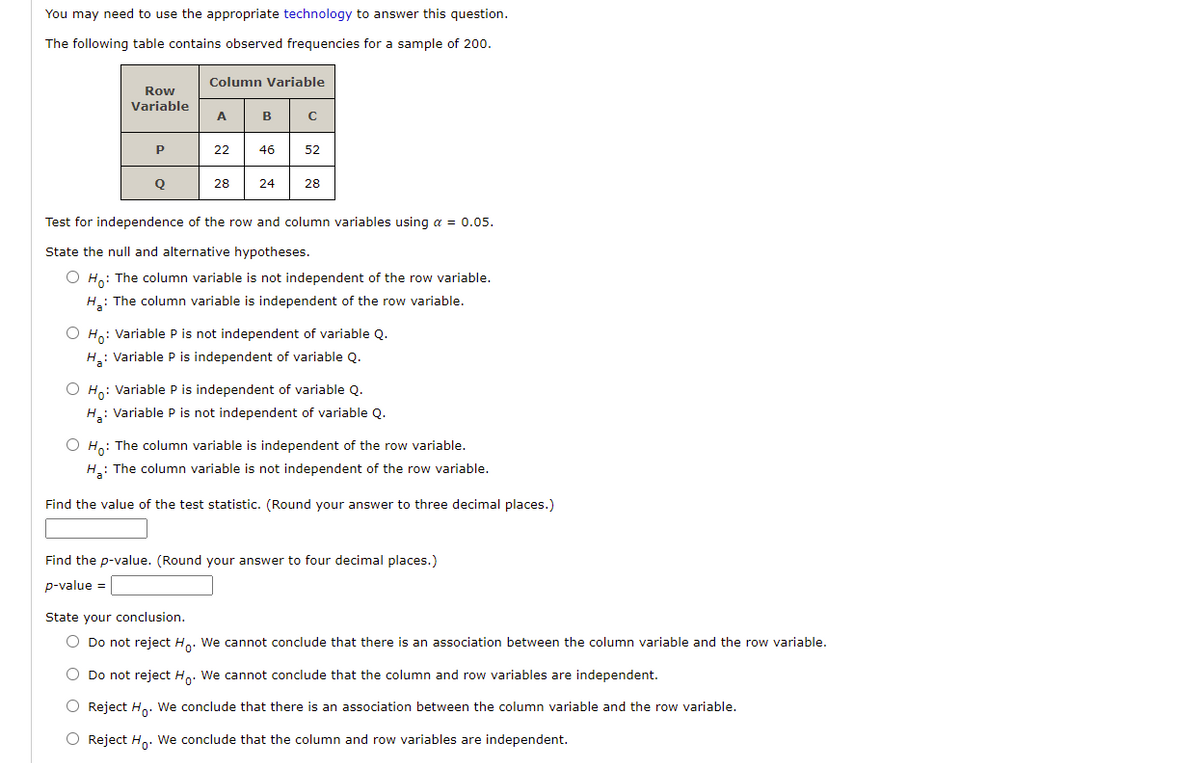
Transcribed Image Text:You may need to use the appropriate technology to answer this question.
The following table contains observed frequencies for a sample of 200.
Column Variable
Row
Variable
A
B
22
46
52
28
24
28
Test for independence of the row and column variables using a = 0.05.
State the null and alternative hypotheses.
O Ho: The column variable is not independent of the row variable.
H: The column variable is independent of the row variable.
O Ho: Variable P is not independent of variable Q.
H: Variable P is independent of variable Q.
O H,: Variable P is independent of variable Q.
H: Variable P is not independent of variable Q.
O Ho: The column variable is independent of the row variable
H.: The column variable is not independent of the row variable.
Find the value of the test statistic. (Round your answer to three decimal places.)
Find the p-value. (Round your answer to four decimal places.)
p-value =
State your conclusion.
O Do not reject H. We cannot conclude that there is an association between the column variable and the row variable.
O Do not reject H.. We cannot conclude that the column and row variables are independent.
O Reject H. We conclude that there is an association between the column variable and the row variable.
O Reject H. We conclude that the column and row variables are independent.
Expert Solution
This question has been solved!
Explore an expertly crafted, step-by-step solution for a thorough understanding of key concepts.

This is a popular solution!

Trending now
This is a popular solution!

Step by step
Solved in 4 steps with 2 images

Knowledge Booster


Learn more about
Need a deep-dive on the concept behind this application? Look no further. Learn more about this topic, statistics and related others by exploring similar questions and additional content below.Recommended textbooks for you
MATLAB: An Introduction with Applications
Statistics
ISBN:
9781119256830
Author:
Amos Gilat
Publisher:
John Wiley & Sons Inc

Probability and Statistics for Engineering and th…
Statistics
ISBN:
9781305251809
Author:
Jay L. Devore
Publisher:
Cengage Learning

Statistics for The Behavioral Sciences (MindTap C…
Statistics
ISBN:
9781305504912
Author:
Frederick J Gravetter, Larry B. Wallnau
Publisher:
Cengage Learning
MATLAB: An Introduction with Applications
Statistics
ISBN:
9781119256830
Author:
Amos Gilat
Publisher:
John Wiley & Sons Inc
Probability and Statistics for Engineering and th…
Statistics
ISBN:
9781305251809
Author:
Jay L. Devore
Publisher:
Cengage Learning
Statistics for The Behavioral Sciences (MindTap C…
Statistics
ISBN:
9781305504912
Author:
Frederick J Gravetter, Larry B. Wallnau
Publisher:
Cengage Learning

Elementary Statistics: Picturing the World (7th E…
Statistics
ISBN:
9780134683416
Author:
Ron Larson, Betsy Farber
Publisher:
PEARSON

The Basic Practice of Statistics
Statistics
ISBN:
9781319042578
Author:
David S. Moore, William I. Notz, Michael A. Fligner
Publisher:
W. H. Freeman

Introduction to the Practice of Statistics
Statistics
ISBN:
9781319013387
Author:
David S. Moore, George P. McCabe, Bruce A. Craig
Publisher:
W. H. Freeman