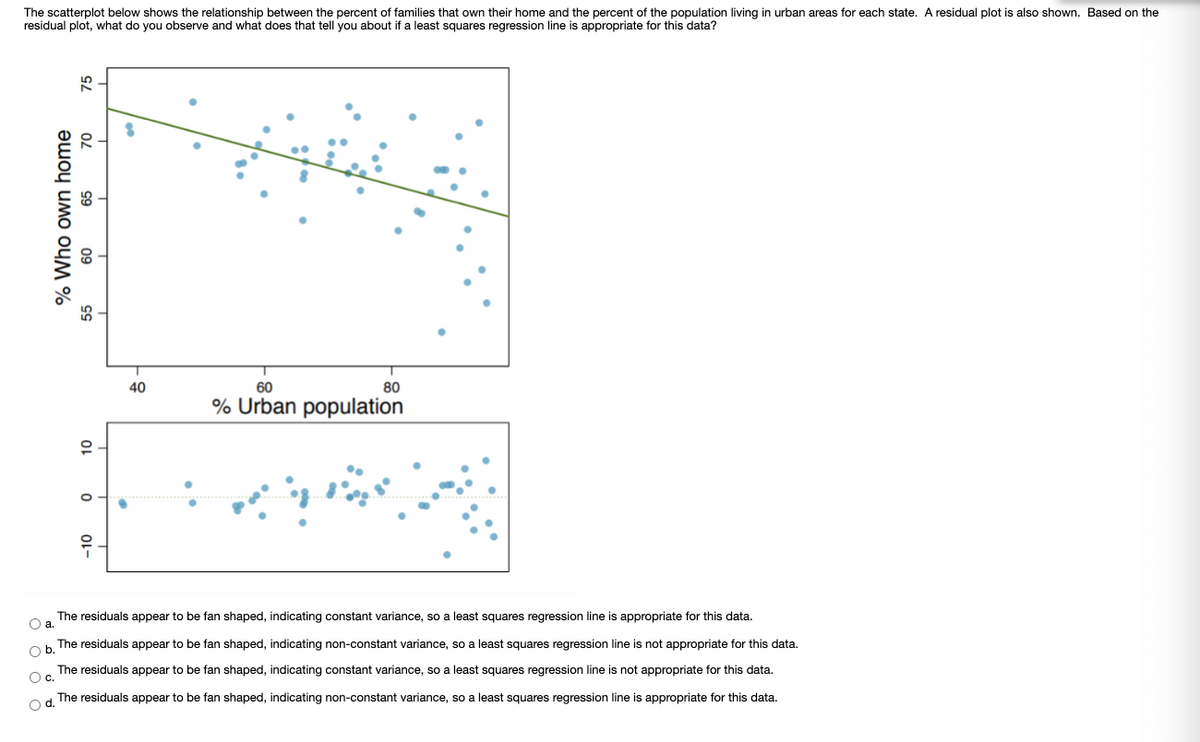
The scatterplot below shows the relationship between the percent of families that own their home and the percent of the population living in urban areas for each state. A residual plot is also shown. Based residual plot, what do you observe and what does that tell you about if a least squares regression line is appropriate for this data? 40 60 80 % Urban population The residuals appear to be fan shaped, indicating constant variance, so a least squares regression line is appropriate for this data. Oa. The residuals appear to be fan shaped, indicating non-constant variance, so a least squares regression line is not appropriate for this data. Ob. The residuals appear to be fan shaped, indicating constant variance, so a least squares regression line is not appropriate for this data. Oc. Od The residuals appear to be fan shaped, indicating non-constant variance, so a least squares regression line is appropriate for this data. % Who own home 75 09


Correlation
Correlation defines a relationship between two independent variables. It tells the degree to which variables move in relation to each other. When two sets of data are related to each other, there is a correlation between them.
Linear Correlation
A correlation is used to determine the relationships between numerical and categorical variables. In other words, it is an indicator of how things are connected to one another. The correlation analysis is the study of how variables are related.
Regression Analysis
Regression analysis is a statistical method in which it estimates the relationship between a dependent variable and one or more independent variable. In simple terms dependent variable is called as outcome variable and independent variable is called as predictors. Regression analysis is one of the methods to find the trends in data. The independent variable used in Regression analysis is named Predictor variable. It offers data of an associated dependent variable regarding a particular outcome.

Step by step
Solved in 2 steps with 1 images


