
ENGR.ECONOMIC ANALYSIS
14th Edition
ISBN: 9780190931919
Author: NEWNAN
Publisher: Oxford University Press
expand_more
expand_more
format_list_bulleted
Related questions
Question
I do not understand how to graph this
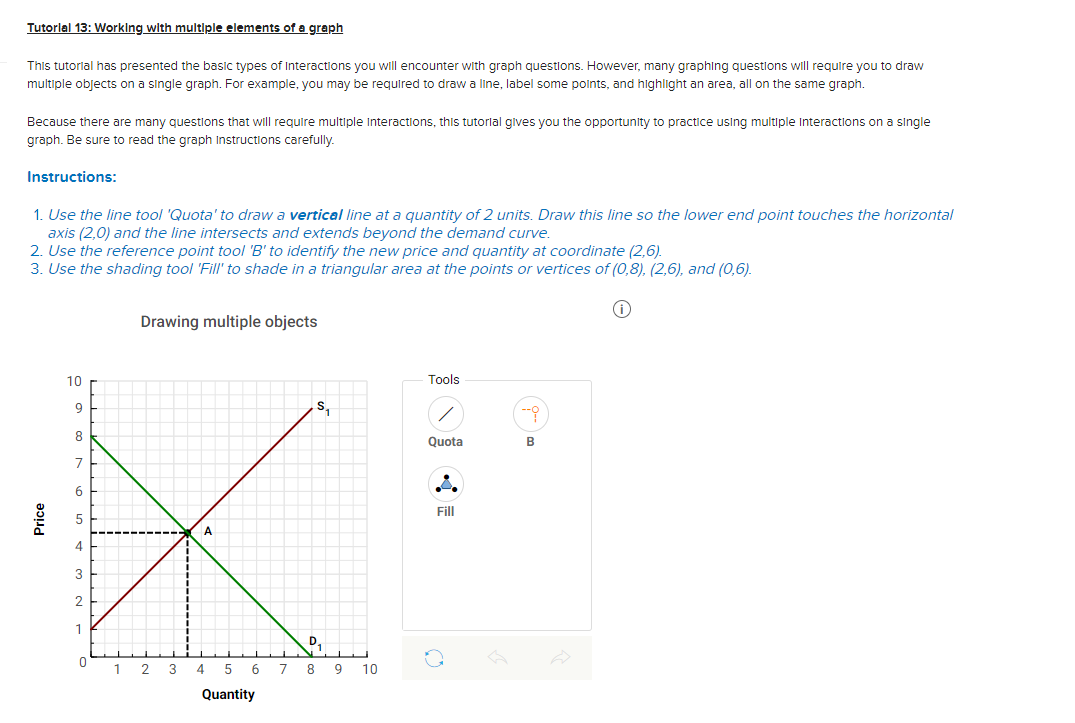

Transcribed Image Text:Tutorial 13: Working with multiple elements of a graph
This tutorial has presented the basic types of Interactions you will encounter with graph questions. However, many graphing questions will require you to draw
multiple objects on a single graph. For example, you may be required to draw a line, label some points, and highlight an area, all on the same graph.
Because there are many questions that will require multiple Interactions, this tutorial gives you the opportunity to practice using multiple Interactions on a single
graph. Be sure to read the graph Instructions carefully.
Instructions:
1. Use the line tool 'Quota' to draw a vertical line at a quantity of 2 units. Draw this line so the lower end point touches the horizontal
axis (2,0) and the line intersects and extends beyond the demand curve.
2. Use the reference point tool 'B' to identify the new price and quantity at coordinate (2,6).
3. Use the shading tool 'Fill' to shade in a triangular area at the points or vertices of (0,8), (2,6), and (0,6).
Price
10
9
8
7
6
5
4
3
2
1
0
Drawing multiple objects
I
A
S₁
1
D
1
1 2 3 4 5 6 7 8 9
Quantity
10
Tools
/
Quota
Fill
-i
B
Expert Solution
This question has been solved!
Explore an expertly crafted, step-by-step solution for a thorough understanding of key concepts.

This is a popular solution

Trending nowThis is a popular solution!

Step by stepSolved in 2 steps with 1 images

Knowledge Booster


Learn more about
Need a deep-dive on the concept behind this application? Look no further. Learn more about this topic, economics and related others by exploring similar questions and additional content below.Similar questions
- Can you help me graph that informationarrow_forwardAlex is a hard-working college sophomore. One Saturday, he decides to work nonstop until he has answered 50 practice problems for his economics course. He starts work at 8:00 AM and uses a table to keep track of his progress throughout the day. He notices that as he gets tired, it takes him longer to solve each problem. Time Total Problems Answered 8:00 AM 0 9:00 AM 20 10:00 AM 35 11:00 AM 45 Noon 50 Use the table to answer the following questions. The marginal, or additional, gain from Alex’s second hour of work, from 9:00 AM to 10:00 AM, is problems. The marginal gain from Alex’s fourth hour of work, from 11:00 AM to noon, is problems. Later, the teaching assistant in Alex’s economics course gives him some advice. “Based on past experience,” the teaching assistant says, “working on 7.5 problems raises a student’s exam score by about the same amount as reading the textbook for 1 hour.” For simplicity, assume students always cover the same…arrow_forwardAs part of its bankruptcy restructuring, General Motors (GM) launched an ad campaign that revealed glimmers of a streamlined GM: fewer brands (Cadillac, Buick, Chevrolet, GMC) and fewer models within each brand A. What research would you have done to determine which vehicle models GM should retain and which it should drop? B. What would you have measured and with what type of measurement scale?arrow_forward
- Calculate the value of Total revenue when price is $33 and the quantity is 71 unitsarrow_forwardThe table below is extracted from Goodland Republic Bureau of Statistics records for 2016 -2017. Use the information to answer the questions that follow. Item Price 2017 (Base Year) Price 2018 Production Price per Unit ($) Production Price per Unit ($) Rice (tons) 50,000 1.50 55,000 2.00 Wheat (tons) 100,000 2.00 98,000 2.50 Tractors mid-size (units) 50,000 23000.00 45,000 2,450.00 Cotton (tons) 120,000 100.00 110,000 120.00 Used cars 5,000 5,000.00 6,000 7,000.00 Manufacture garments (tons) 150,000 50.00 145,000 70.00 Eggs (trays) 2,000 2.50 2,300 3.50 Coca Cola (litres) 6,000 0.80 6,500 1.20 Pepsi Cola (litres) 700 1.10 850 1.50 Beef (tons) 5,000 6.50 4,800 8.50 Second Hand Clothes (tons) 500 15.00 450 25.00 Alcoholic Beverages (litres) 500 3.25 600 3.75 Milk (litres) 7,000 2.30 7,500 2.50 Examine the…arrow_forwardStatement You can select the object to see the slope. Your score depends on the order in which you plot the points. If you plot one point incorrectly and the others correctly, you will receive partial credit for that object. You can adjust the position of the object on the graph without changing its shape by selecting it in between the marked points and moving it around the graph. Connected Points 000 0 Curves 00 0arrow_forward
- Dear expert bro hand written not allowed.arrow_forwardonly typed solutionarrow_forwardDemand Factor Average American household income Roundtrip airfare from Des Moines (DSM) to Atlantic City (ACY) Room rate at the Continental Hotel and Casino, which is near the Rivers PRICE (Dollars per room) Use the graph input tool to help you answer the following questions. You will not be graded on any changes you make to this graph. Note: Once you enter a value in a white field, the graph and any corresponding amounts in each grey field will change accordingly. 500 450 400 350 300 250 200 150 100 50 0 0 Demand 50 100 150 200 250 300 350 400 450 500 QUANTITY (Hotel rooms) Graph Input Tool Market for Rivers's Hotel Rooms Price (Dollars per room) Quantity Demanded (Hotel rooms per night) Demand Factors Average Income (Thousands of dollars) Initial Value $50,000 per year $200 per roundtrip $250 per night Airfare from DSM to ACY (Dollars per roundtrip) Room Rate at Continental (Dollars per night) 350 150 50 200 250 ?arrow_forward
arrow_back_ios
SEE MORE QUESTIONS
arrow_forward_ios
Recommended textbooks for you
 Principles of Economics (12th Edition)EconomicsISBN:9780134078779Author:Karl E. Case, Ray C. Fair, Sharon E. OsterPublisher:PEARSON
 Engineering Economy (17th Edition)EconomicsISBN:9780134870069Author:William G. Sullivan, Elin M. Wicks, C. Patrick KoellingPublisher:PEARSON
 Principles of Economics (MindTap Course List)EconomicsISBN:9781305585126Author:N. Gregory MankiwPublisher:Cengage Learning
 Managerial Economics: A Problem Solving ApproachEconomicsISBN:9781337106665Author:Luke M. Froeb, Brian T. McCann, Michael R. Ward, Mike ShorPublisher:Cengage Learning
 Managerial Economics & Business Strategy (Mcgraw-...EconomicsISBN:9781259290619Author:Michael Baye, Jeff PrincePublisher:McGraw-Hill Education
Principles of Economics (12th Edition)
Economics
ISBN:9780134078779
Author:Karl E. Case, Ray C. Fair, Sharon E. Oster
Publisher:PEARSON
Engineering Economy (17th Edition)
Economics
ISBN:9780134870069
Author:William G. Sullivan, Elin M. Wicks, C. Patrick Koelling
Publisher:PEARSON
Principles of Economics (MindTap Course List)
Economics
ISBN:9781305585126
Author:N. Gregory Mankiw
Publisher:Cengage Learning
Managerial Economics: A Problem Solving Approach
Economics
ISBN:9781337106665
Author:Luke M. Froeb, Brian T. McCann, Michael R. Ward, Mike Shor
Publisher:Cengage Learning
Managerial Economics & Business Strategy (Mcgraw-...
Economics
ISBN:9781259290619
Author:Michael Baye, Jeff Prince
Publisher:McGraw-Hill Education