
Chemistry
10th Edition
ISBN: 9781305957404
Author: Steven S. Zumdahl, Susan A. Zumdahl, Donald J. DeCoste
Publisher: Cengage Learning
expand_more
expand_more
format_list_bulleted
Related questions
Question
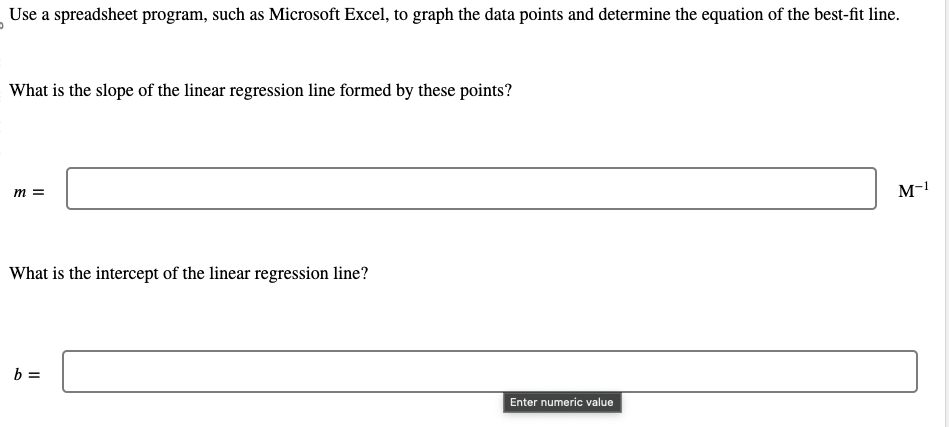

Transcribed Image Text:Use a spreadsheet program, such as Microsoft Excel, to graph the data points and determine the equation of the best-fit line.
What is the slope of the linear regression line formed by these points?
m =
What is the intercept of the linear regression line?
b =
Enter numeric value
M-1

Transcribed Image Text:The spectroscopic data in the table is generated with five solutions of known concentration.
Concentration (M)
0.0179
0.0358
0.0716
0.143
0.286
Absorbance
0.1425
0.1896
0.5722
1.126
2.110
Expert Solution
This question has been solved!
Explore an expertly crafted, step-by-step solution for a thorough understanding of key concepts.

This is a popular solution

Trending nowThis is a popular solution!

Step by stepSolved in 3 steps with 1 images

Knowledge Booster


Learn more about
Need a deep-dive on the concept behind this application? Look no further. Learn more about this topic, chemistry and related others by exploring similar questions and additional content below.Similar questions
- Calculate the mean and sample standard deviation for the following data: 90.0, 90.0, 85.0, 83.0, 80.0, 78.0, 77.0, 75.0, 70.0. Group of answer choices 79.8 ±± 5.83 79.8 ±± 6.23 80.9 ±± 6.75 80.9 ±± 6.37arrow_forwardDr. Caras was characterizing a cytochrome (an iron containing protein) from a new strain of bacteria. He obtained eight measurements of the percent iron in the protein: 0.4908%, 0.4902%, 0.4899%, 0.4899%, 0.5012%, 0.4891%, 0.4903%, and 0.4892%. Calculate the mean (x) and standard deviation (s) for these results. x = S= Use the Grubbs test to determine if one of these values is an outlier. What is the value of Gcalculated? Gcalculated = % %arrow_forwardPerform the calculation and record the answer with the correct number of significant figures. (34.123 +4.20) (98.76546.639) F4 Z $ F5 010 % = A F6 F7 & F8 F9 Ale A- F10 !!! A+ F11 Pause ] F12 Scr Lk PrtSc SysRq +arrow_forward
- Solving a proportion of the form a/(x+b) = c/x Solve for x. 4 8 %3D x-4 x-6 X = ?.arrow_forward4. Two technicians have analyzed a standard with a known nitrate concentration of 25.0 mg/L. The results are shown below. Results from Technician 1 (mg/mL) Results from Technician 2 (mg/mL) 23.4 23.8 TO 23.2 Trial 1 2 3 4 5 23.4 22.9 23.6 Average: 23.4 30.1 22.4 27.5 21.3 Average: 24.9 Choose the statement below which is FALSE. a. Technician 2 has greater accuracy than technician 1. b. Technician 1 has greater precision than technician 2. c. Results from technician 1 have both systematic and random error. d. Results from technician 2 only have determinant error.arrow_forwardUse a spreadsheet to calculate the mean and standard deviation of the data set. 54.99, 54.40, 54.60, 54.63, 54.36 The figure shows a suggested setup for your spreadsheet, where you enter the data in the highlighted cells and enter formulas in cells C4:D8 and B9:B11 to carry out the appropriate calculations. mean: standard deviation:arrow_forward
- STARTING AMOUNT X 0.1 10-⁹ A human hair is 75.0 ADD FACTOR x( ) 0.0000300 104 3.00 1 2.54 um across. How many inches is this? 0.001 10⁹ 10-6 ANSWER 100 0.01 1000 30.0 0.00300 104 RESET 2 0.330 75.0 10.0 106arrow_forwardI need help on figuring out which are the four data points that can be considered outliers, below is my graph following the intructions but, not I dont know which points are outliners.arrow_forwardA bucket of water has a volume of 0.473 kL . How many dL is this? STARTING AMOUNT ADD FACTOR ANSWER RESET *( ) 47300 1000 0.001 0.01 10 4730 0.0000473 100 0.473 0.1 1 0.00473 473 0.000473 kL dL +arrow_forward
- 1arrow_forward2. Estimate the absolute deviation and the coefficient of variation for the results of the following calculations. Round each result so that it contains only significant digits. The numbers in parentheses are absolute standard deviations. 2 (1.203 (+0.004) x 103 + 18.25 (10.005) x 102 – 34.012(±0.001)) 3.9201 (+0.0006) x 10-3 y =arrow_forward8.0 cm 5.8 cm 3.9 cm 1.5 cm A B C D Figure 2. Developed TLC plate of commercial analgesic and standards Use the data presented in Figure 2 as basis for your answer. The TLC plate used is 5 cm by 10 cm. Note that dot A is for the commercial analgesic, dot B is for the aspirin standard, dot C is for the acetaminophen standard, and dot D is for the caffeine standard. What component/s islare present in the commercial analgesic as confirmed on the developed chromatograph?arrow_forward
arrow_back_ios
SEE MORE QUESTIONS
arrow_forward_ios
Recommended textbooks for you
- ChemistryChemistryISBN:9781305957404Author:Steven S. Zumdahl, Susan A. Zumdahl, Donald J. DeCostePublisher:Cengage Learning
 ChemistryChemistryISBN:9781259911156Author:Raymond Chang Dr., Jason Overby ProfessorPublisher:McGraw-Hill Education
 Principles of Instrumental AnalysisChemistryISBN:9781305577213Author:Douglas A. Skoog, F. James Holler, Stanley R. CrouchPublisher:Cengage Learning
  Organic ChemistryChemistryISBN:9780078021558Author:Janice Gorzynski Smith Dr.Publisher:McGraw-Hill Education
 Chemistry: Principles and ReactionsChemistryISBN:9781305079373Author:William L. Masterton, Cecile N. HurleyPublisher:Cengage Learning
 Elementary Principles of Chemical Processes, Bind...ChemistryISBN:9781118431221Author:Richard M. Felder, Ronald W. Rousseau, Lisa G. BullardPublisher:WILEY
Chemistry
Chemistry
ISBN:9781305957404
Author:Steven S. Zumdahl, Susan A. Zumdahl, Donald J. DeCoste
Publisher:Cengage Learning
Chemistry
Chemistry
ISBN:9781259911156
Author:Raymond Chang Dr., Jason Overby Professor
Publisher:McGraw-Hill Education
Principles of Instrumental Analysis
Chemistry
ISBN:9781305577213
Author:Douglas A. Skoog, F. James Holler, Stanley R. Crouch
Publisher:Cengage Learning
Organic Chemistry
Chemistry
ISBN:9780078021558
Author:Janice Gorzynski Smith Dr.
Publisher:McGraw-Hill Education
Chemistry: Principles and Reactions
Chemistry
ISBN:9781305079373
Author:William L. Masterton, Cecile N. Hurley
Publisher:Cengage Learning
Elementary Principles of Chemical Processes, Bind...
Chemistry
ISBN:9781118431221
Author:Richard M. Felder, Ronald W. Rousseau, Lisa G. Bullard
Publisher:WILEY