
MATLAB: An Introduction with Applications
6th Edition
ISBN: 9781119256830
Author: Amos Gilat
Publisher: John Wiley & Sons Inc
expand_more
expand_more
format_list_bulleted
Related questions
Question
| Hospital | Births | Personnel |
| 1 | 312 | 792 |
| 2 | 1077 | 1762 |
| 3 | 1027 | 2310 |
| 4 | 355 | 328 |
| 5 | 168 | 181 |
| 6 | 3810 | 1077 |
| 7 | 735 | 742 |
| 8 | 1 | 131 |
| 9 | 1733 | 1594 |
| 10 | 257 | 233 |
| 11 | 169 | 241 |
| 12 | 430 | 203 |
| 13 | 0 | 325 |
| 14 | 2049 | 676 |
| 15 | 211 | 347 |
| 16 | 16 | 79 |
| 17 | 2648 | 505 |
| 18 | 2450 | 1543 |
| 19 | 1465 | 755 |
| 20 | 0 | 959 |
| 21 | 1993 | 325 |
| 22 | 2275 | 954 |
| 23 | 1494 | 1091 |
| 24 | 1313 | 671 |
| 25 | 451 | 300 |
| 26 | 1689 | 753 |
| 27 | 1583 | 607 |
| 28 | 2017 | 929 |
| 29 | 995 | 354 |
| 30 | 2045 | 408 |
| 31 | 1686 | 1251 |
| 32 | 503 | 386 |
| 33 | 126 | 144 |
| 34 | 2026 | 2047 |
| 35 | 1412 | 1343 |
| 36 | 1517 | 1723 |
| 37 | 0 | 96 |
| 38 | 0 | 529 |
| 39 | 2719 | 3694 |
| 40 | 1074 | 1042 |
| 41 | 1421 | 1071 |
| 42 | 762 | 1525 |
| 43 | 3194 | 1983 |
| 44 | 496 | 670 |
| 45 | 1442 | 1653 |
| 46 | 0 | 167 |
| 47 | 1107 | 793 |
| 48 | 2989 | 841 |
| 49 | 113 | 316 |
| 50 | 0 | 93 |
| 51 | 0 | 373 |
| 52 | 173 | 263 |
| 53 | 1064 | 943 |
| 54 | 759 | 605 |
| 55 | 1317 | 596 |
| 56 | 1751 | 1165 |
| 57 | 0 | 568 |
| 58 | 0 | 507 |
| 59 | 714 | 479 |
| 60 | 99 | 136 |
| 61 | 2243 | 1456 |
| 62 | 3966 | 3486 |
| 63 | 1308 | 885 |
| 64 | 0 | 243 |
| 65 | 2514 | 1001 |
| 66 | 3714 | 3301 |
| 67 | 126 | 337 |
| 68 | 556 | 1193 |
| 69 | 1327 | 1161 |
| 70 | 415 | 322 |
| 71 | 216 | 185 |
| 72 | 339 | 205 |
| 73 | 1217 | 1224 |
| 74 | 2641 | 1704 |
| 75 | 790 | 815 |
| 76 | 520 | 712 |
| 77 | 35 | 156 |
| 78 | 1168 | 1769 |
| 79 | 793 | 875 |
| 80 | 0 | 790 |
| 81 | 0 | 308 |
| 82 | 14 | 70 |
| 83 | 0 | 494 |
| 84 | 0 | 111 |
| 85 | 0 | 1618 |
| 86 | 0 | 244 |
| 87 | 776 | 525 |
| 88 | 451 | 472 |
| 89 | 0 | 94 |
| 90 | 145 | 297 |
| 91 | 1284 | 847 |
| 92 | 1 | 234 |
| 93 | 319 | 401 |
| 94 | 2154 | 3928 |
| 95 | 295 | 198 |
| 96 | 496 | 1231 |
| 97 | 589 | 545 |
| 98 | 806 | 663 |
| 99 | 701 | 820 |
| 100 | 3968 | 2581 |
| 101 | 0 | 1298 |
| 102 | 0 | 126 |
| 103 | 3655 | 2534 |
| 104 | 0 | 251 |
| 105 | 0 | 85 |
| 106 | 0 | 432 |
| 107 | 0 | 864 |
| 108 | 0 | 66 |
| 109 | 3063 | 556 |
| 110 | 169 | 347 |
| 111 | 66 | 239 |
| 112 | 827 | 973 |
| 113 | 570 | 439 |
| 114 | 0 | 1849 |
| 115 | 0 | 102 |
| 116 | 0 | 262 |
| 117 | 342 | 885 |
| 118 | 494 | 549 |
| 119 | 0 | 611 |
| 120 | 0 | 330 |
| 121 | 0 | 1471 |
| 122 | 0 | 75 |
| 123 | 286 | 262 |
| 124 | 235 | 328 |
| 125 | 339 | 377 |
| 126 | 398 | 575 |
| 127 | 1275 | 1916 |
| 128 | 5699 | 2620 |
| 129 | 1364 | 571 |
| 130 | 714 | 703 |
| 131 | 0 | 535 |
| 132 | 0 | 160 |
| 133 | 0 | 202 |
| 134 | 779 | 1330 |
| 135 | 0 | 370 |
| 136 | 2202 | 3123 |
| 137 | 3346 | 2745 |
| 138 | 1071 | 815 |
| 139 | 352 | 576 |
| 140 | 254 | 502 |
| 141 | 0 | 808 |
| 142 | 0 | 50 |
| 143 | 699 | 728 |
| 144 | 2462 | 4087 |
| 145 | 3311 | 3012 |
| 146 | 0 | 68 |
| 147 | 4207 | 3090 |
| 148 | 0 | 1358 |
| 149 | 339 | 576 |
| 150 | 130 | 284 |
| 151 | 91 | 145 |
| 152 | 1143 | 2312 |
| 153 | 0 | 1124 |
| 154 | 0 | 336 |
| 155 | 509 | 415 |
| 156 | 1026 | 1779 |
| 157 | 0 | 338 |
| 158 | 447 | 453 |
| 159 | 1161 | 437 |
| 160 | 0 | 261 |
| 161 | 922 | 609 |
| 162 | 562 | 647 |
| 163 | 78 | 61 |
| 164 | 0 | 2074 |
| 165 | 2122 | 2232 |
| 166 | 0 | 948 |
| 167 | 0 | 409 |
| 168 | 0 | 153 |
| 169 | 710 | 741 |
| 170 | 1165 | 1625 |
| 171 | 466 | 538 |
| 172 | 1106 | 789 |
| 173 | 376 | 395 |
| 174 | 0 | 956 |
| 175 | 637 | 362 |
| 176 | 0 | 144 |
| 177 | 352 | 229 |
| 178 | 447 | 396 |
| 179 | 1227 | 2256 |
| 180 | 963 | 731 |
| 181 | 3038 | 1477 |
| 182 | 0 | 102 |
| 183 | 0 | 106 |
| 184 | 868 | 939 |
| 185 | 1189 | 392 |
| 186 | 2849 | 3516 |
| 187 | 1728 | 785 |
| 188 | 2171 | 607 |
| 189 | 364 | 273 |
| 190 | 0 | 630 |
| 191 | 2993 | 1379 |
| 192 | 0 | 1108 |
| 193 | 1964 | 583 |
| 194 | 601 | 514 |
| 195 | 387 | 216 |
| 196 | 1946 | 1593 |
| 197 | 545 | 1055 |
| 198 | 0 | 399 |
| 199 | 838 | 834 |
| 200 | 51 | 104 |
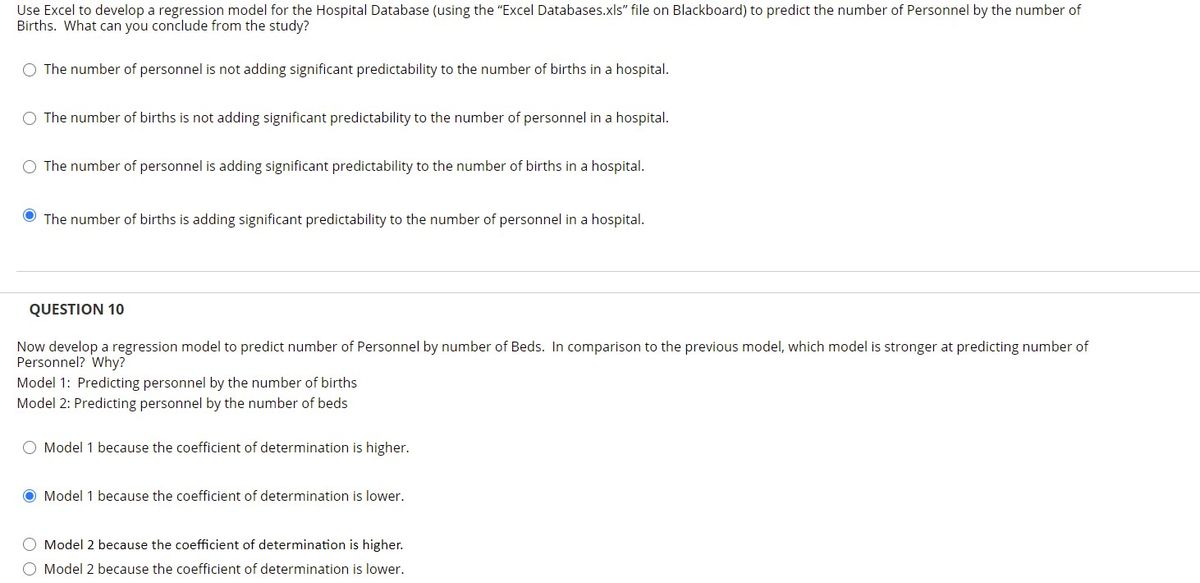

Transcribed Image Text:Use Excel to develop a regression model for the Hospital Database (using the "Excel Databases.xls" file on Blackboard) to predict the number of Personnel by the number of
Births. What can you conclude from the study?
O The number of personnel is not adding significant predictability to the number of births in a hospital.
O The number of births is not adding significant predictability to the number of personnel in a hospital.
O The number of personnel is adding significant predictability to the number of births in a hospital.
O The number of births is adding significant predictability to the number of personnel in a hospital.
QUESTION 10
Now develop a regression model to predict number of Personnel by number of Beds. In comparison to the previous model, which model is stronger at predicting number of
Personnel? Why?
Model 1: Predicting personnel by the number of births
Model 2: Predicting personnel by the number of beds
O Model 1 because the coefficient of determination is higher.
O Model 1 because the coefficient of determination is lower.
O Model 2 because the coefficient of determination is higher.
O Model 2 because the coefficient of determination is lower.
Expert Solution
This question has been solved!
Explore an expertly crafted, step-by-step solution for a thorough understanding of key concepts.

This is a popular solution

Trending nowThis is a popular solution!

Step by stepSolved in 2 steps with 1 images

Knowledge Booster


Learn more about
Need a deep-dive on the concept behind this application? Look no further. Learn more about this topic, statistics and related others by exploring similar questions and additional content below.Similar questions
- please help me solve this practice question 7065 6870 6858 6641 6306 6671 6663 6492 6569 6601 6653 6729 7237 6911 6784 7312 7313 7082 7462 7311 6994 7399 7231 7666 7574 7706 7561 7198 7255 7116 7362 7511 7773 7776 7547 7567 7679 7627 7883 7274 7072 7165 7025 7125 7195 7318 7461 7624 7717 7450 7108 7053 6768 6896 7158 7152 7171 6902 6968 6619 6427 6567 6422 6686 6976 7069 7222 7381 7495 7460 7721 7804 7558 7781 7517 7795 7976 8038 8122 7854 7924 7754 7824 7935 8233 8304 8094 7974 7659 7538 7282 7435 7399 7712 8259 7935 8142 7696 7366 7182 7184 7408 7408 7805 7187 7074 7141 7245 7518 7748 7620 7434 7489 7345 7557 7490 7625 7691 7698 8019 8015 8064 8068 7839 7923 7939 8215 8730 8487 8444 8364 7893 8183 8226 7987 8287…arrow_forwardwinds through an urban area and another in a suburban park. The table shows the number of users who walk, jog. or bike the trail. Activity Walk Jog Bike Total Urban 76 58 23 157 Type of Park Suburban 125 76 42 243 Total 201 134 65 400 What proportion of suburban park users bike on the park trail? 0.1050 0.1728 0.6075 0.6461 Mark this and return Save and Exit Nex Submit ava orig the m https://r09.core.learn.edgenuity.com/ContentViewers/AssessmentViewer/Activity# New At powcoc Ai Aa MacBoo k A esc 20 F3 000 O00 F4 F1 F2 II F8 F5 F6 F7 F9arrow_forwardRefer to the table summarizing service times (seconds) of dinners at a fast food restaurant. How many individuals are included in the summary? Is it possible to identify the exact values of all of the original service times? Time (sec) Frequency 60dash–119 99 120dash–179 2121 180dash–239 1313 240dash–299 33 300dash–359 44arrow_forward
- ID gender dist. from Hunter(miles) commute time (min) Borough 1 M 3.2 20 Manhattan 2 M 7.5 42 Other 3 M 8.8 84 Other 4 M 2.5 12 Manhattan 5 M 5.4 32 Other 6 M 16 63 Other 7 F 4.4 21 Manhattan 8 F 17.2 95 Other 9 F 8.4 72 Other 10 F 4.5 25 Manhattan 11 F 2.7 24 Manhattan 12 F 20.7 80 Other 13 F 14 91 Other 14 F 5.4 24 Manhattan 15 F 5.5 37 Manhattan 16 F 3.4 25 Manhattan Find the z-scores for each student's commute time.arrow_forwardJudge Disposed Appealed Reversed Court Fred Cartolano 3037 137 12 Common Thomas Crush 3372 119 10 Common Patrick Dinkelacker 1258 44 8 Common Timothy Hogan 1954 60 7 Common Robert Kraft 3138 127 7 Common William Mathews 2264 91 18 Common William Morrissey 3032 121 22 Common Norbert Nadel 2959 131 20 Common Arthur Ney Jr. 3219 125 14 Common Richard Niehaus 3353 137 16 Common Thomas Nurre 3000 121 6 Common John O'Connor 2969 129 12 Common Robert Ruehlman 3205 145 18 Common J. Howard Sundermann Jr. 955 60 10 Common Ann Marie Tracey 3141 127 13 Common Ralph Winkler 3089 88 6 Common Total 43945 1762 199 -- Penelope Cunningham 2729 7 1 Domestic Patrick Dinkelacker 6001 19 4 Domestic Deborah Gaines 8799 48 9 Domestic Ronald Panioto 12970 32 3 Domestic Total 30499 106 17 -- Mike Allen 6149 43 4 Municipal Nadine Allen 7812 34 6 Municipal Timothy Black 7954 41 6 Municipal David Davis 7736 43 5 Municipal Leslie Isaiah Gaines 5282 35 13…arrow_forward2. We wish to analyze the monthly water usage of a production plant, Y (in gallons), with respect to its monthly production X₁ (in tons), mean monthly temperature X₂ (in °F) and the monthly number of days X3 of plant operation using the data given in the file 'WATER.xlsx'. The following models are considered: I: II: Y = Y = Bo + B₁X₁ + B₂X2 + ß3X3 + E, Bo + B₁X₁ + B2X2 + B3X3 + B₁X1X2 + B5X₁X3 + B6X2X3 + ε Perform your tests at a = 10% in this question. (a) Generate a matrix scatter plot and state the relationship among these variables. (b) Use R/Minitab to estimate the parameters of Model I, set up three hypotheses to test whether each variable is useful given that the other variables are in the model. (c) In Model II, the interaction terms among these three variables are considered. Using the sum of squared residuals from the estimates of models I and II, do an F-test to test the whether all these interaction terms are useful jointly in predicting the monthly water usage of the…arrow_forward
- 3) How many Coffee Drinkers are there? 58 Total People 29 Tea Drinkers 8 10 ? 6 ? ? Beer Drinkers ? 12 Coffee Drinkersarrow_forwardNone, Low, Medium, High ( alcohol consumption) Never Smokes None 450 Low 205 Medium 190 High 75 Smoker None 425 Low 255 Medium 170 High 30 What is the Frequency of : None smoking , no alcohol Snokers who dont consume alcohol Never smoke high alcohol Smokers and high alcoholarrow_forwardPrice SqFt 600000 2767 545000 2731 314900 2051 419000 2084 365000 2270 479000 1950 323000 1235 339900 2116 399000 1644 552000 2415 223017 1375 315777 1529 499000 2223 575000 2327 342000 1879 375000 1558 349000 2012 485000 1200 549888 1410 295000 1943 399000 1827 306999 1840 265200 1636 479000 2357 249700 1152 539500 2650 365000 2154 295900 1279 499000 2156 526000 2493 514900 2390 346000 1347 460000 2120 389000 1917 499000 1200 405000 2643 389900 1789 545000 2327 339000 1742 425000 1746 479000 1421 392000 2569 Interpret b0 in the context of this problem. Interpret b1 in the context of this problem. What percent of total variation in prices is explained by the regression model? Provide evidence to support your answer. Please include the excel function.arrow_forward
- Sale Price 12400 10400 12100 10000 11000 8895 7675 9975 6350 10470 9895 11250 8795 12500 9340 10150 9200 9395 11000 10640 10000 7500 8000 10440 10200 10300 9740 9280 10930 8000 9000 7680 9400 10730 7350 12240 11970 8240 9910 10080 9440 8970 9500 10050 10130 11400 8500 7500 9090 10500 According to the National Automobile Dealers Association, the mean price for used cars is $10,192. A manager of a Kansas City used car dealership reviewed a sample of 50 recent used car sales at the dealership in an attempt to determine whether the population mean price for used cars at this particular dealership differed from the national mean. The prices for the sample of 50 cars are shown in the file named UsedCars. Formulate the hypotheses that can be used to determine whether a difference exists in the mean price for used cars at the dealership. What is the p-value? At , what is your conclusion?arrow_forwardHospital Births Personnel 1 312 792 2 1077 1762 3 1027 2310 4 355 328 5 168 181 6 3810 1077 7 735 742 8 1 131 9 1733 1594 10 257 233 11 169 241 12 430 203 13 0 325 14 2049 676 15 211 347 16 16 79 17 2648 505 18 2450 1543 19 1465 755 20 0 959 21 1993 325 22 2275 954 23 1494 1091 24 1313 671 25 451 300 26 1689 753 27 1583 607 28 2017 929 29 995 354 30 2045 408 31 1686 1251 32 503 386 33 126 144 34 2026 2047 35 1412 1343 36 1517 1723 37 0 96 38 0 529 39 2719 3694 40 1074 1042 41 1421 1071 42 762 1525 43 3194 1983 44 496 670 45 1442 1653 46 0 167 47 1107 793 48 2989 841 49 113 316 50 0 93 51 0 373 52 173 263 53 1064 943 54 759 605 55 1317 596 56 1751 1165 57 0 568 58 0 507 59 714 479 60 99 136 61 2243 1456 62 3966 3486 63 1308 885 64 0 243 65 2514 1001 66 3714 3301 67 126 337 68 556 1193 69 1327 1161 70 415 322 71 216 185 72 339 205 73 1217 1224…arrow_forwardi really need help with question number 2arrow_forward
arrow_back_ios
SEE MORE QUESTIONS
arrow_forward_ios
Recommended textbooks for you
- MATLAB: An Introduction with ApplicationsStatisticsISBN:9781119256830Author:Amos GilatPublisher:John Wiley & Sons Inc
 Probability and Statistics for Engineering and th...StatisticsISBN:9781305251809Author:Jay L. DevorePublisher:Cengage Learning
 Statistics for The Behavioral Sciences (MindTap C...StatisticsISBN:9781305504912Author:Frederick J Gravetter, Larry B. WallnauPublisher:Cengage Learning
  Elementary Statistics: Picturing the World (7th E...StatisticsISBN:9780134683416Author:Ron Larson, Betsy FarberPublisher:PEARSON
 The Basic Practice of StatisticsStatisticsISBN:9781319042578Author:David S. Moore, William I. Notz, Michael A. FlignerPublisher:W. H. Freeman
 Introduction to the Practice of StatisticsStatisticsISBN:9781319013387Author:David S. Moore, George P. McCabe, Bruce A. CraigPublisher:W. H. Freeman
MATLAB: An Introduction with Applications
Statistics
ISBN:9781119256830
Author:Amos Gilat
Publisher:John Wiley & Sons Inc
Probability and Statistics for Engineering and th...
Statistics
ISBN:9781305251809
Author:Jay L. Devore
Publisher:Cengage Learning
Statistics for The Behavioral Sciences (MindTap C...
Statistics
ISBN:9781305504912
Author:Frederick J Gravetter, Larry B. Wallnau
Publisher:Cengage Learning
Elementary Statistics: Picturing the World (7th E...
Statistics
ISBN:9780134683416
Author:Ron Larson, Betsy Farber
Publisher:PEARSON
The Basic Practice of Statistics
Statistics
ISBN:9781319042578
Author:David S. Moore, William I. Notz, Michael A. Fligner
Publisher:W. H. Freeman
Introduction to the Practice of Statistics
Statistics
ISBN:9781319013387
Author:David S. Moore, George P. McCabe, Bruce A. Craig
Publisher:W. H. Freeman