
MATLAB: An Introduction with Applications
6th Edition
ISBN: 9781119256830
Author: Amos Gilat
Publisher: John Wiley & Sons Inc
expand_more
expand_more
format_list_bulleted
Related questions
Question
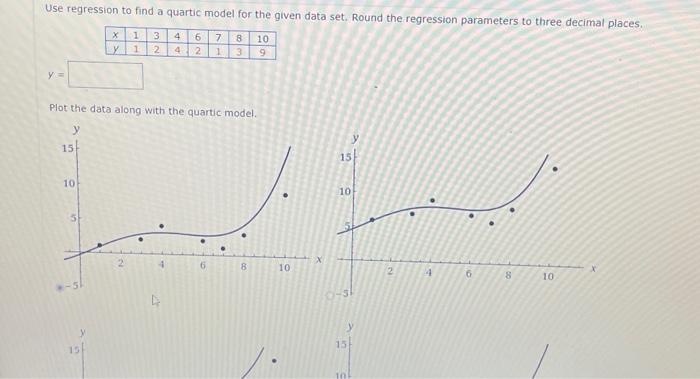

Transcribed Image Text:Use regression to find a quartic model for the given data set. Round the regression parameters to three decimal places.
1 3
1 2
y =
15
10
5
X
Y
15
Plot the data along with the quartic model.
y
2
4
H
44
4
62
7
1
6
8
3
10
9
8
10
15
10
15
y
101
2
4
6
8
10
x
Expert Solution
This question has been solved!
Explore an expertly crafted, step-by-step solution for a thorough understanding of key concepts.

This is a popular solution

Trending nowThis is a popular solution!

Step by stepSolved in 3 steps with 3 images

Knowledge Booster

Similar questions
- Data were gathered and displayed on the scatter plot. 15 y 14 13 12 11 10 9 8 7 6 5 4 3 2 1 0 1 2 3 4 5 6 7 8 9 10 11 12 13 14 15 Which of the following is the best equation to model the data? ŷ = 11.5(0.81)* Oŷ = 8.1(0.115)* Oŷ= -0.115x+8.1 Oŷ=-0.81x+11.5arrow_forwardFind the equation of the regression line for the given data. Then construct a scatter plot of the data and draw the regression line. The table shows the shoe size and heights (in.) for 6 men. Shoe size, x Height, y 7.5 66.5 Find the regression equation. ŷ=x+ y (Round to three decimal places as needed.) 9.5 69.5 10.5 70.5 11.0 72.5 13.0 72.5 13.5 73.5arrow_forwardThe data show the chest size and weight of several bears. Find the regression equation, letting chest size be the independent (x) variable. Then find the best predicted weight of a bear with a chest size of 40 inches. Is the result close to the actual weight of 352 pounds? Use a significance level of 0.05. Chest size (inches) *Weight (pounds) 44 54 328 528 41 55 39 51 418 580 296 503 Click the icon to view the critical values of the Pearson correlation coefficient r. - What is the regression equation? x (Round to one decimal place as needed.)arrow_forward
- Listed below is the multiple regression equation for predicting Y by X₁ through Xs. Y is the number of sales per month. X₁ is the number of sales calls made X2 is the number of hours on the showroom floor X3 is the amount spent on radio ads X is the number of text messages sent Xs is the number of email messages sent Regression Statistics R Square 0.634 Standard Error 7.6796 Observations 45 Intercept X₁ X₂ X3 XA Xs Coefficients Standard Error 6.8163 0.1005 -0.3207 0.2084 0.1221 0.0943 77.1211 1.9439 -11.123 0.1144 11.34 1.23 What is the computed value of the F statistic you would use to test the significance of the entire model? Round your answer to two decimal places.arrow_forwardHeight, x 772 628 518 508 496 483 stories, y 51 48 44 43 37 35 Find the equation of the regression line for the given data. Then construct a scatter plot of the data and draw the regression line. (The pair of variables have a significant correlation.) Then use the regression equation to predict the value of y for each of the given x-values, if meaningful. The table below shows the heights (in feet) and the number of stories of six notable buildings in a city. (a) x = 498 feet (b) x = 640 feet (c) x = 345 feet (d) 735 feet Find the regression equation.Now construct a scatter plot of the data and draw the regression line. (a) Now use the regression equation to predict the value of y for each of the given x-values, if meaningful. Because the correlation between x and y is significant, the equation of the regression line can be used to predict y-values. However, prediction values are meaningful only for x-values in the range of the data. Begin with x = 498. Since x = 498…arrow_forwardCompute the least-squares regression equation for the given data set. Use a TI-84 calculator. Round the slope and y-intercept to at least four decimal places. 43 37 15 19 24 37 18 y 72 67 25 29 42 65 32 Send data to Excel Regression line equation: y = 1.7777x + 1.5838arrow_forward
- I need help with this questionarrow_forwardUse the data in the table below to complete parts (a) through (d). 39 33 40 47 42 50 59 56 51 24 22 27 32 30 31 31 27 29 Click the icon to view details on how to construct and interpret residual plots. (a) Find the equation of the regression line. (Round to three decimal places as needed.) (b) Construct a scatter plot of the data and draw the regression line. Plot the x-values on the horizontal axis and the y-values on the vertical axis. Choose the correct graph below. OA. В. Oc. OD. 34 70, (c) Construct a residual plot. Plot the x-values on the horizontal axis and the residuals on the vertical axis. Choose the correct graph below. O A. Ов. Oc. OD. (d) Determine if there are any patterns in the residual plot and explain what they suggest about the relationship between the variables. The residual plot a pattern because the residuals about 0. This implies the regression line a good representation of the relationship between the variables.arrow_forwardFind the equation of the regression line for the given data. Then construct a scatter plot of the data and draw the regression line. (The pair of variables have a significant correlation.) Then use the regression equation to predict the valuo of v for each of the given x-values, if meaningful. The table below shows the heights (in feet) and the number of stories of six notable buildings in a city. Height, x Stories, y 762 621 508 480 (b) x = 641 feet (d) x = 726 feet 515 491 (a) x= 498 feet (c) x = 810 feet 51 46 44 42 38 37 Find the regression equation. ý=x+ (D (Round the slope to three decimal places as needed. Round the y-intercept to two decimal places as needed.) Choose the correct graph below. OA. OB O B. Oc. OD. 60- 604 60+ 800 B00 G 800 Height (feet) 800 Height (feet) 800 Height (feet) Height (feet) (a) Predict the value of y for x = 498. Choose the correct answer below. OA 40 ОВ. 50 O C. 47 O D. not meaningful (b) Predict the value of y for x 641. Choose the correct answer…arrow_forward
- Find the equation of the regression line for the given data. Then construct a scatter plot of the data and draw the regression line. (The pair of variables have a significant correlation.) Then use the regression equation to predict the value of y for each of the given x-values, if meaningful. The number of hours 6 students spent for a test and their scores on that test are shown below. Hours spent studying, x 1 2 2 3 4 6 Test score, y 39 44 52 47 64 70 (a)x=2hours (b)x=3.5hours (c)x=13hours (d)x=1.5hours Find the regression equation. y=______ x+ (_____) (Round the slope to three decimal places as needed. Round the y-intercept to two decimal places as needed.)arrow_forwardFind the equation of the regression line for the given data. Then construct a scatter plot of the data and draw the regression line. The table shows the shoe size and heights (in.) for 6 men. Shoe size, x Height, y Find the regression equation. ŷ=x+ (Round to three decimal places as needed.) Choose the correct graph below. O A. Height (in.) 75+ 65- 8 Shoe size N O B. Height (in.) 75+ 65+ 8.5 65.0 Shoe size 9.5 66.0 o 11.0 67.0 O C. Height (in.) 75 65 8 Shoe size 12.0 73.0 Q 13.0 71.0 D. Height (in.) 75- 65 13.5 73.0 Shoe size Q oarrow_forwardFind the equation of the regression line for the given data. Then construct a scatter plot of the data and draw the regression line. (The pair of variables have a significant correlation.) Then use the regression equation to predict the value of y for each of the given x-values, if meaningful. The number of hours 6 students spent for a test and their scores on that test are shown below. Hours spent studying, x 1 2 2 Test score, y 39 45 50 48 3 5 6 62 72 (a) x = 2 hours (c) x = 15 hours (b) x = 3.5 hours (d) x = 4.5 hours Find the regression equation. y = x+ y= (Round the slope to three decimal places as needed. Round the y-intercept to two decimal places as needed.)arrow_forward
arrow_back_ios
arrow_forward_ios
Recommended textbooks for you
- MATLAB: An Introduction with ApplicationsStatisticsISBN:9781119256830Author:Amos GilatPublisher:John Wiley & Sons Inc
 Probability and Statistics for Engineering and th...StatisticsISBN:9781305251809Author:Jay L. DevorePublisher:Cengage Learning
 Statistics for The Behavioral Sciences (MindTap C...StatisticsISBN:9781305504912Author:Frederick J Gravetter, Larry B. WallnauPublisher:Cengage Learning
  Elementary Statistics: Picturing the World (7th E...StatisticsISBN:9780134683416Author:Ron Larson, Betsy FarberPublisher:PEARSON
 The Basic Practice of StatisticsStatisticsISBN:9781319042578Author:David S. Moore, William I. Notz, Michael A. FlignerPublisher:W. H. Freeman
 Introduction to the Practice of StatisticsStatisticsISBN:9781319013387Author:David S. Moore, George P. McCabe, Bruce A. CraigPublisher:W. H. Freeman
MATLAB: An Introduction with Applications
Statistics
ISBN:9781119256830
Author:Amos Gilat
Publisher:John Wiley & Sons Inc
Probability and Statistics for Engineering and th...
Statistics
ISBN:9781305251809
Author:Jay L. Devore
Publisher:Cengage Learning
Statistics for The Behavioral Sciences (MindTap C...
Statistics
ISBN:9781305504912
Author:Frederick J Gravetter, Larry B. Wallnau
Publisher:Cengage Learning
Elementary Statistics: Picturing the World (7th E...
Statistics
ISBN:9780134683416
Author:Ron Larson, Betsy Farber
Publisher:PEARSON
The Basic Practice of Statistics
Statistics
ISBN:9781319042578
Author:David S. Moore, William I. Notz, Michael A. Fligner
Publisher:W. H. Freeman
Introduction to the Practice of Statistics
Statistics
ISBN:9781319013387
Author:David S. Moore, George P. McCabe, Bruce A. Craig
Publisher:W. H. Freeman