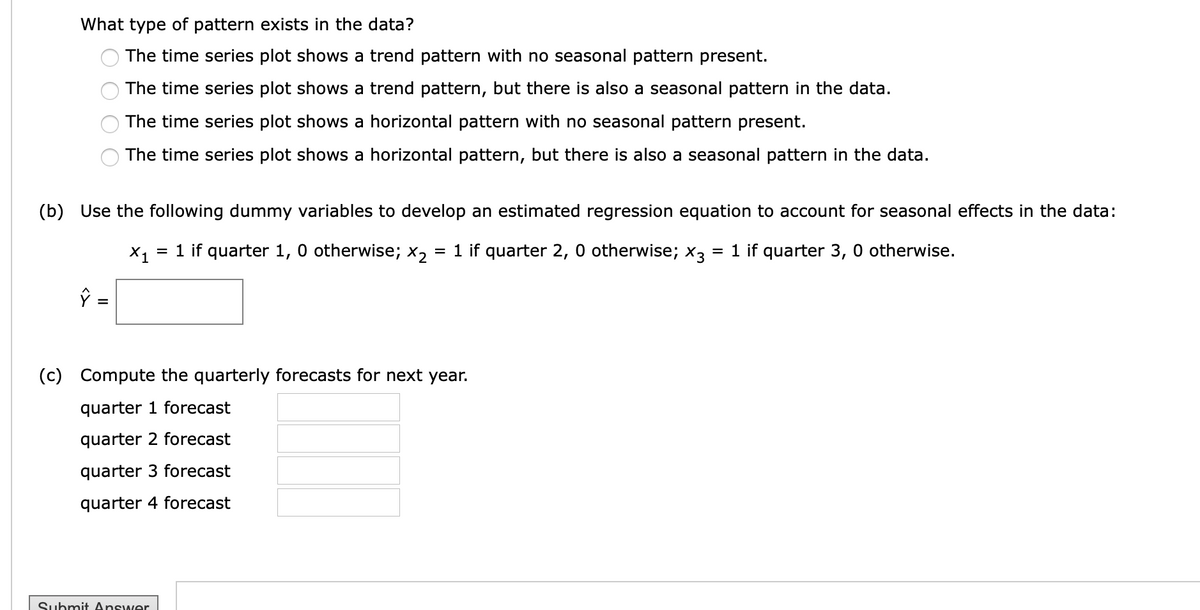
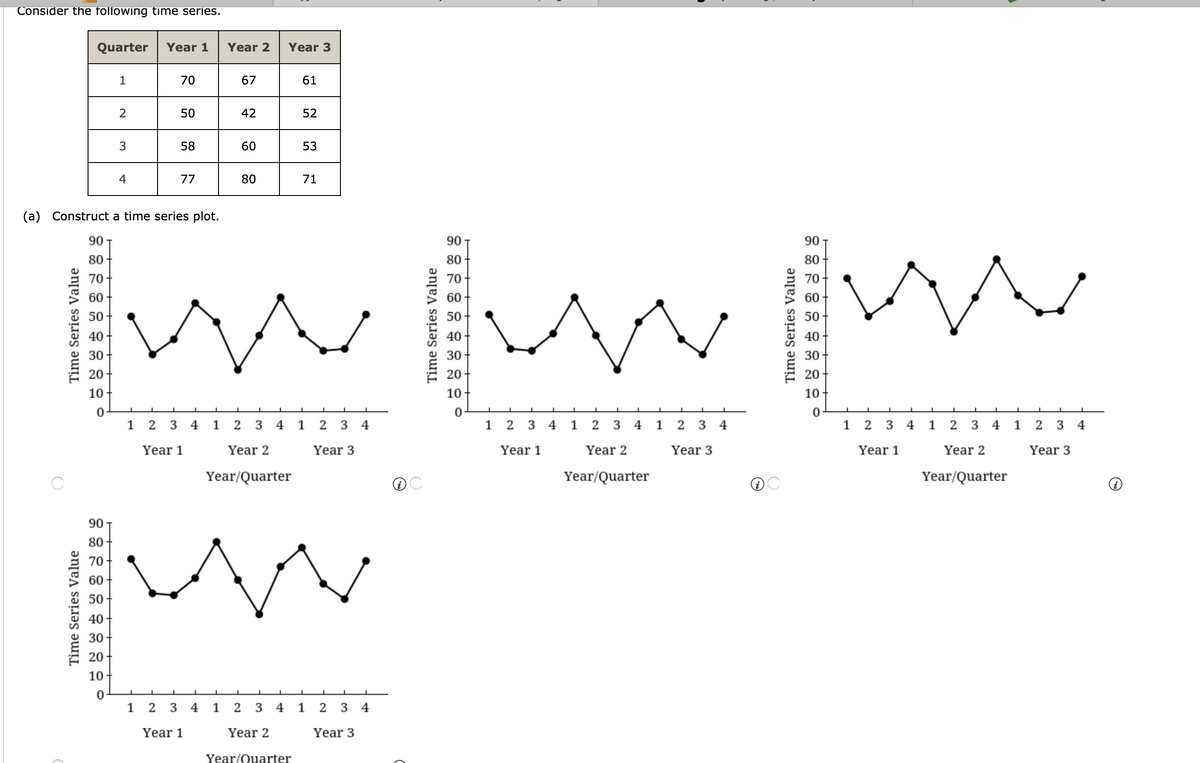
What type of pattern exists in the data? The time series plot shows a trend pattern with no seasonal pattern present. The time series plot shows a trend pattern, but there is also a seasonal pattern in the data. The time series plot shows a horizontal pattern with no seasonal pattern present. The time series plot shows a horizontal pattern, but there is also a seasonal pattern in the data. Use the following dummy variables to develop an estimated regression equation to account for seasor x1 = 1 if quarter 1, 0 otherwise; x2 = 1 if quarter 2, 0 otherwise; x3 = 1 if quarter 3, 0 otherwis


Correlation
Correlation defines a relationship between two independent variables. It tells the degree to which variables move in relation to each other. When two sets of data are related to each other, there is a correlation between them.
Linear Correlation
A correlation is used to determine the relationships between numerical and categorical variables. In other words, it is an indicator of how things are connected to one another. The correlation analysis is the study of how variables are related.
Regression Analysis
Regression analysis is a statistical method in which it estimates the relationship between a dependent variable and one or more independent variable. In simple terms dependent variable is called as outcome variable and independent variable is called as predictors. Regression analysis is one of the methods to find the trends in data. The independent variable used in Regression analysis is named Predictor variable. It offers data of an associated dependent variable regarding a particular outcome.


Trending now
This is a popular solution!

Step by step
Solved in 3 steps with 2 images


