Principles of Instrumental Analysis
7th Edition
ISBN: 9781305577213
Author: Douglas A. Skoog, F. James Holler, Stanley R. Crouch
Publisher: Cengage Learning
Question
Book Icon
Chapter 1, Problem 1.10QAP
Interpretation Introduction

(a)

Interpretation:

The least-squares estimates of the slope and intercept for the given data set should be calculated.

Concept introduction:

The least-squares estimates of a set of data behaving linearly are defined as follows:

y=mx+b

When y and x are variables, m is the slope of the line and b is the y intercept.

m can be calculated using:

m=SxySxxwhere,Sxy=xiyixiyiN and Sxx=xi2(xi)2N

Similarly, b can be calculated using:b=y¯mx¯where, y¯=yiN and  x¯=xiN(xi and yi are individual pairs of data for x and y and N is the number of data pairs)

Expert Solution
Check Mark

Answer to Problem 1.10QAP

m ~0.0701b ~0.0083

Explanation of Solution

Given:

Principles of Instrumental Analysis, Chapter 1, Problem 1.10QAP , additional homework tip  1

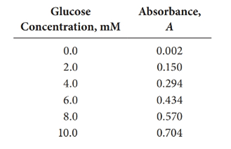
First, the data should be utilized to obtain xi2yi2, and xiyi values and their sums (appear in the raw after the dark line) as shown in the table below.

Glucose Concentration, mM (xi)Absorbance (yi)xi2yi2xiyi0.00.00200.00000402.00.15040.02250.34.00.294160.0864361.1766.00.434360.1883562.6048.00.570640.32494.5610.00.7041000.4956167.0430.02.1542201.11781215.68

How to calculate m:

The above calculated values in the table are used to calculate Sxy, and Sxx as shown below:

Sxy=xiyixiyiN Sxy=15.6830.0×2.1546=4.91Sxx=xi2(xi)2NSxx=220(30.0)26=70Now, let's calculate m as follows:m=SxySxx=4.9170=0.07014285710.0701

How to calculate b:

First, use the data in the above table to obtain y¯ and x¯ as shown below:

 y¯=yiN y¯=2.1546=0.359x¯=xiN=30.06=5Now, b can be calculated as follows:b=y¯mx¯=0.3590.0701×5=0.00828571430.0083

Interpretation Introduction

(b)

Interpretation:

Standard deviations of the slope and intercept and the standard error of the estimates for the given data set should be calculated using the LINEST function in EXCEL.

Concept introduction:

In order to use the LINEST function in EXCEL to obtain statistical values for a given data set, the following command should be typed on an EXCEL spread sheet, in which the given data is already been typed in two columns.

=(known_ys,[known_xs],[constant],[stats])

Expert Solution
Check Mark

Answer to Problem 1.10QAP

Standard deviation of the slope (Sm)=0.0007Standard deviation of the intercept (Sb)=0.004Standard error of the estimates (Sr) = 0.0056

Explanation of Solution

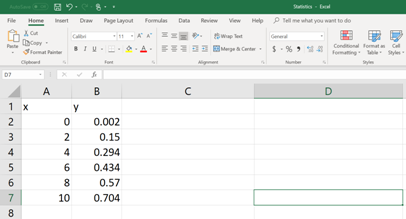
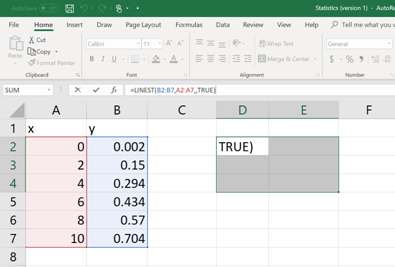
First, the data set should be entered in to an EXCEL spread sheet (See the figure below).

Principles of Instrumental Analysis, Chapter 1, Problem 1.10QAP , additional homework tip  2

Then on a different cell, type the following command (See figure below). In order to enter the cell numbers of the unknown x and y data, select the area where the data have entered.

=LINEST(A2:A7,B2:B7,,TRUE)

Principles of Instrumental Analysis, Chapter 1, Problem 1.10QAP , additional homework tip  3

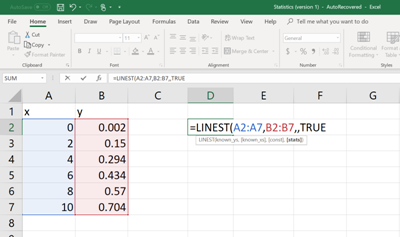
Once the formula command is written and the parenthesis is closed, then hit the ENTER button. Now, the value of m will be generated as shown in the figure below.

Principles of Instrumental Analysis, Chapter 1, Problem 1.10QAP , additional homework tip  4

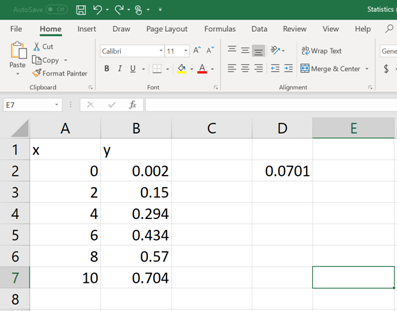
Now, select few more cells including the cell in which the command is typed and then click on the cursor bar (See below).

Principles of Instrumental Analysis, Chapter 1, Problem 1.10QAP , additional homework tip  5

Then hit CTRL+SHIFT+ENTER. Several numerical values will be generated as shown below.

Principles of Instrumental Analysis, Chapter 1, Problem 1.10QAP , additional homework tip  6

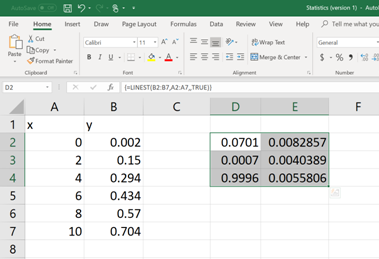
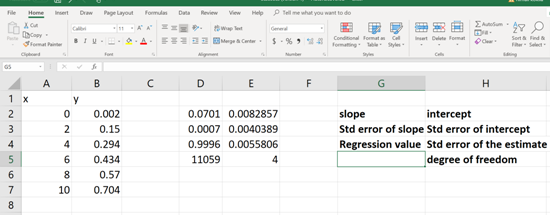
Each of these numerical values is relevant to a statistical data (mentioned in BOLD, See below). Now pick the apocopate answers required.

Principles of Instrumental Analysis, Chapter 1, Problem 1.10QAP , additional homework tip  7

Interpretation Introduction

(c)

Interpretation:

The 95% confidence intervals for the slope and the intercept should be determined.

Concept introduction:

The general formula to calculate the 95% confidence intervals for a statistic relevant to a regression analysis is as follows:

95% CI for a given statistic=staistic value± critical value for the confidence interval×standard error of the statisticFor slope (m), the equation can be rewritten as,95% CI=m±t×SmFor intercept (b), the equation can be rewritten as,95% CI=b±t×Sb

Expert Solution
Check Mark

Answer to Problem 1.10QAP

95% CI for m=0.070±0.00295% CI for b=0.08±0.01

Explanation of Solution

95% CI=m±t×Sm95% CI=b±t×Sb

The t value of the above equation depends on the confidence level (95 % in this question) and the degrees of freedom of the data set.

The degrees of freedom for a regression analysis = N2. Therefore, in this question, the degrees of freedom = 4.

Once the degree of freedom is calculated the t value can be extracted from a standard table similar to the table shown below:

Principles of Instrumental Analysis, Chapter 1, Problem 1.10QAP , additional homework tip  8

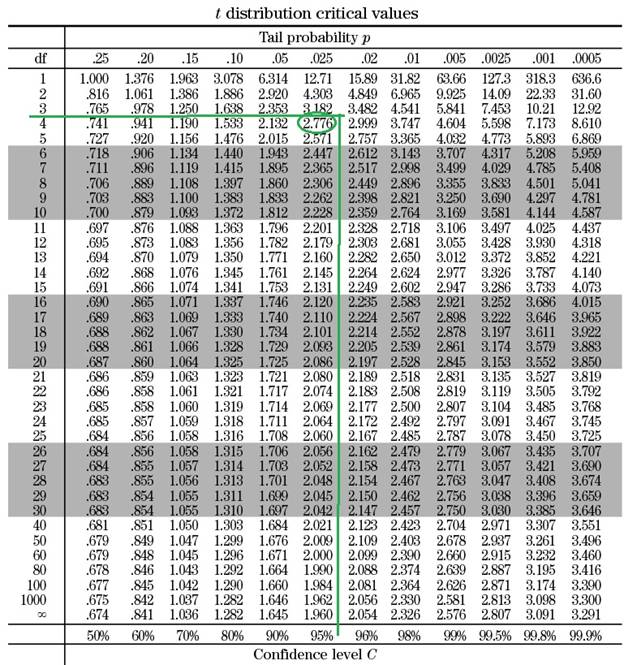
Based on the table, when the degree of freedom is 4 and the cofidence interval is 95 %, the t value is 2.776 (2.78).

For slope (m),95% CI=m±t×Sm=0.0701±2.78×0.0007=0.0701±0.00194695% CI for m=0.0701±0.002For intercept (b),95% CI=b±t×Sb=0.0083±2.78×0.004=0.0083±0.0111295% CI for b=0.08±0.01

Interpretation Introduction

(d)

Interpretation:

The glucose concentration and its standard deviation of a serum sample, which gave an absorbance of 0.350 should be calculated.

Concept introduction:

To determine an unknown glucose concentration c from the least-squares line, the valueof the absorbancey, the slope ( m ) and intercept ( b ) can be used as follows,

cx=ycbm

The standard deviation of c ( Sc ) is calculated by,

Sc=Sym1M+1N+(y¯cy¯)2m2SxxWhere,M=number of replicate resultsN=number of standardsy¯c=mean response for the unknownSy,y¯, and Sxx were defined in early steps.

Expert Solution
Check Mark

Answer to Problem 1.10QAP

cx=0.487 mMSc=0.09 mM

Explanation of Solution

Plug in the appropriate numerical values in the below equation to determine the cx value.

cx=ycbm=0.3500.00830.0701=4.874465054.87

How to calculate Sc:

In the given question,M=1, because only one data has obtainedN=6y¯c=yc=0.350,bacuase only one data has obtainedSy,y¯, and Sxx were calculated in early steps.Now, plug in the values in the below equation to calculate the standard deviation of the glucose concentration of the serum sample.Sc=Srm1M+1N+(y¯cy¯)2m2Sxx=0.00560.070111+16+(0.3500.359)20.0701270=0.08629531690.09

Want to see more full solutions like this?

Subscribe now to access step-by-step solutions to millions of textbook problems written by subject matter experts!
Students have asked these similar questions
A volumetric calcium analysis on samples of the blood serum of a patient believed to be suffering from a hyperparathyroid condition produced the following data:  mmol Ca/L =  3.10, 3.08, 3.28, 3.15, 3.26, 3.12, 3.14, 3.18, 3.25, 3.11, 2.95. Calculate: Mean Standard deviation Coefficient of variation What is the 95% confidence interval for the mean of the data, assuming no prior information about the precision of the analysis? Apply the Q test to the following data sets to determine whether the outlying result should be retained or rejected at the 95% confidence level. ( work on the first measurements according to your case)
An analysis of a sample containing mercury was performedusing a standard procedure and a new procedure. The samplewas analyzed 6 times by the new procedure and 8 times by thestandard procedure resulting in standard deviations of 0.355 and0.524 for the new and standard procedures, respectively. If thepooled standard deviation for the data was 0.66 and thetabulated F value at the 95% confidence level was 4.88, Thefollowing statement(s) are true:Select one or more:A. The calculated F value is 2.179B. We are confident that there is no significant statisticalC. difference between the results of the two methodsD. There is no significant statistical difference between theprecision of the two methodsThe calculated F value is 3.216
Knowledge Booster
Background pattern image
Recommended textbooks for you
Text book image
Principles of Instrumental Analysis
Chemistry
ISBN:9781305577213
Author:Douglas A. Skoog, F. James Holler, Stanley R. Crouch
Publisher:Cengage Learning
Text book image
Fundamentals Of Analytical Chemistry
Chemistry
ISBN:9781285640686
Author:Skoog
Publisher:Cengage
Text book image
Appl Of Ms Excel In Analytical Chemistry
Chemistry
ISBN:9781285686691
Author:Crouch
Publisher:Cengage
Text book image
Principles of Modern Chemistry
Chemistry
ISBN:9781305079113
Author:David W. Oxtoby, H. Pat Gillis, Laurie J. Butler
Publisher:Cengage Learning