Statistics for Business and Economics - Aplia Access
13th Edition
ISBN: 9781337094535
Author: Anderson
Publisher: Cengage
expand_more
expand_more
format_list_bulleted
Concept explainers
Videos
Textbook Question
Chapter 1, Problem 13SE
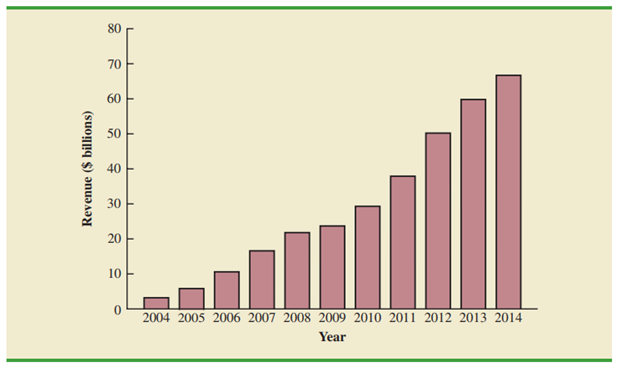
Figure 1.7 provides a bar chart showing the annual revenue for Google from 2004 to 2014. (The Wall Street Journal, August 19, 2014).
- a. What is the variable of interest?
- b. Arc the data categorical or quantitative?
- c. Arc the data time series or cross-sectional?
- d. Comment on the trend in Google revenue over time.
FIGURE 1.7 GOOGLE REVENUE
Expert Solution & Answer

Trending nowThis is a popular solution!

Chapter 1 Solutions
Statistics for Business and Economics - Aplia Access
Ch. 1 - Discuss the differences between statistics as...Ch. 1 - Tablet PC Comparison provides a wide variety of...Ch. 1 - Refer to Table 1.6. a. What is the average cost...Ch. 1 - Table 1.7 shows data for eight cordless telephones...Ch. 1 - Refer to the data set in Table 1.7. a. What is the...Ch. 1 - J.D. Power and Associates surveys new automobile...Ch. 1 - The Kroger Company is one of the largest grocery...Ch. 1 - The Tennessean, an online newspaper located in...Ch. 1 - The Commerce Department reported receiving the...Ch. 1 - The Bureau of Transportation Statistics Omnibus...
Ch. 1 - In a Gallup telephone survey conducted on April...Ch. 1 - The Hawaii Visitors Bureau collects data on...Ch. 1 - Figure 1.7 provides a bar chart showing the annual...Ch. 1 - The following data show the number of rental cars...Ch. 1 - Every year, the U.S. Coast Guard collects data and...Ch. 1 - A manager of a large corporation recommends a...Ch. 1 - A random telephone survey of 1021 adults (aged 18...Ch. 1 - A Bloomberg Businessweek North American subscriber...Ch. 1 - A survey of 131 investment managers in Barrons Big...Ch. 1 - A seven-year medical research study reported that...Ch. 1 - A survey conducted by Better Homes and Gardens...Ch. 1 - Pew Research Center is a nonpartisan polling...Ch. 1 - A sample of midterm grades for five students...Ch. 1 - Table 1.8 shows a data set containing information...
Knowledge Booster


Learn more about
Need a deep-dive on the concept behind this application? Look no further. Learn more about this topic, statistics and related others by exploring similar questions and additional content below.Similar questions
- Table 3 gives the annual sales (in millions of dollars) of a product from 1998 to 20006. What was the average rate of change of annual sales (a) between 2001 and 2002, and (b) between 2001 and 2004?arrow_forwardTable 4 gives the population of a town (in thousand) from 2000 to 2008. What was the average rate of change of population (a) between 2002 and 2004, and (b) between 2002 and 2006?arrow_forwardTable 6 shows the year and the number ofpeople unemployed in a particular city for several years. Determine whether the trend appears linear. If so, and assuming the trend continues, in what year will the number of unemployed reach 5 people?arrow_forward
- Enter the data from Table 2 into a graphing calculator and graph the ranking scatter plot. Determine whetherthe data from the table would likely represent a function that is linear, exponential, or logarithmic.arrow_forwardDoes Table 1 represent a linear function? If so, finda linear equation that models the data.arrow_forwardUse the table of values you made in part 4 of the example to find the limiting value of the average rate of change in velocity.arrow_forward
arrow_back_ios
arrow_forward_ios
Recommended textbooks for you

 Algebra & Trigonometry with Analytic GeometryAlgebraISBN:9781133382119Author:SwokowskiPublisher:Cengage
 Functions and Change: A Modeling Approach to Coll...AlgebraISBN:9781337111348Author:Bruce Crauder, Benny Evans, Alan NoellPublisher:Cengage Learning
 Glencoe Algebra 1, Student Edition, 9780079039897...AlgebraISBN:9780079039897Author:CarterPublisher:McGraw Hill
Algebra & Trigonometry with Analytic Geometry
Algebra
ISBN:9781133382119
Author:Swokowski
Publisher:Cengage
Functions and Change: A Modeling Approach to Coll...
Algebra
ISBN:9781337111348
Author:Bruce Crauder, Benny Evans, Alan Noell
Publisher:Cengage Learning
Glencoe Algebra 1, Student Edition, 9780079039897...
Algebra
ISBN:9780079039897
Author:Carter
Publisher:McGraw Hill
Use of ALGEBRA in REAL LIFE; Author: Fast and Easy Maths !;https://www.youtube.com/watch?v=9_PbWFpvkDc;License: Standard YouTube License, CC-BY
Compound Interest Formula Explained, Investment, Monthly & Continuously, Word Problems, Algebra; Author: The Organic Chemistry Tutor;https://www.youtube.com/watch?v=P182Abv3fOk;License: Standard YouTube License, CC-BY
Applications of Algebra (Digit, Age, Work, Clock, Mixture and Rate Problems); Author: EngineerProf PH;https://www.youtube.com/watch?v=Y8aJ_wYCS2g;License: Standard YouTube License, CC-BY