
Videos
The following data show the number of rental cars in service for three rental car companies: Hertz, Avis, and Dollar, over a four-year period.
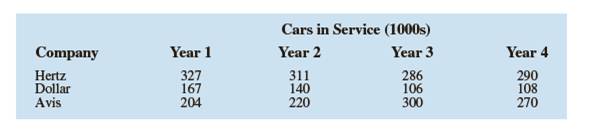
a. Construct a time series graph for the years 1 to 4 showing the number of rental cars in service for each company. Show the time series for all three companies on the same graph.
b. Comment on who appears to be the market share leader and how the market shares are changing over time.
c. Construct a bar chart showing rental cars in service for Year 4. Is this chart based on cross-sectional or time series data?
Want to see the full answer?
Check out a sample textbook solution
Chapter 1 Solutions
Mindtap Business Statistics, 1 Term (6 Months) Printed Access Card For Anderson/sweeney/williams' Essentials Of Modern Business Statistics With Microsoft Office Excel, 7th (mindtap Course List)


- The following table shows the number, in millions, of women employed outside the home in the given year.arrow_forwardFor each successive presidential term from Franklin Pierce (the 14th president, elected in 1853) to George W. H. Bush (41st president), the party affiliation controlling the White House is shown below, where R designates Republican and D designates Democrat. (Reference: The New York Times Almanac.)Historical Note: We start this sequence with the 14th president because earlier presidents belonged to political parties such as the Federalist or Wigg party (not Democratic or Republican). In cases in which a president died in office or resigned, the period during which the vice president finished the term is not counted as a new term. The one exception is the case in which Lincoln (a Republican) was assassinated and the vice president Johnson (a Democrat) finished the term. D D R R D R R R R D R D R R R R D D R R D D D D D R R D D R R D R R R Test the sequence for randomness at the 5% level of significance. Use the following outline. (b) Find the number of runs R, n1, n2,…arrow_forwardThe following table gives the annual salary for the troupearrow_forward
- The Energy Information Administration of the U.S. Department of Energy providedtime series data for the U.S. average price per gallon of conventional regular gasolinebetween January 2007 and February 2014 (Energy Information Administration website,March 2014). Use the Internet to obtain the average price per gallon of conventionalregular gasoline since February 2014.a. Extend the graph of the time series shown in Figure 1.1.b. What interpretations can you make about the average price per gallon of conventionalregular gasoline since February 2014?c. Does the time series continue to show a summer increase in the average price pergallon? Explain.arrow_forwardThe following table shows the number of siblings and daily allowance of 12 students from a Grade 11 class:arrow_forwardCan you identify a time series from the following? The number of "likes" on Gucci Facebook page for a new handbag, as of now Distance travelled by airline passengers for the top 4 airliners in 1965 Quarterly unemployment rate in Namibia, 2015-2020 Gross Domestic Product per capita of Zimbabwe in 2020arrow_forward
- Respond to each of the items using the following time series data. Period Demand 1 104 2 132 3 117 4 120 5 104 6 141 7 120 8 136 9 109 10 143 11 142 12 109 13 113 14 124 15 113 16 107arrow_forwardFor the hawkins company, the monthly percentages of all shipments received on timeover the past 12 months are 80, 82, 84, 83, 83, 84, 85, 84, 82, 83, 84, and 83.a. construct a time series plot. What type of pattern exists in the data?arrow_forwardThe following is a record of Michael Jordan's remarkable basketball career up through 1998 (when he retired for the second time). SEASON AVERAGE POINTS PER GAME 1986-87 37.1 1987-88 35.0 1988-89 32.5 1989-90 33.6 1990-91 31.5 1991-92 30.1 1992-93 30.6…arrow_forward
- The following chart shows "living wage" jobs in Rochester per 1000 working age adults over a 5 year period. Year 1997 1998 1999 2000 2001 Jobs 630 680 715 745 770 What is the average rate of change in the number of living wage jobs from 1997 to 1999?--------- Jobs/YearWhat is the average rate of change in the number of living wage jobs from 1999 to 2001?---------- Jobs/Yeararrow_forwardThe following information looks at computer ownership by year. 1985 8.2 (percentage of households) 1990 15.0 1994 22.8 1995 24.1 1998 36.6 1999 42.1 2000 51.0 Construct a timeline (recognizing that time intervals are not even!) Comment about any trends you might see.arrow_forwardCalculate the starting and ending point for each of the five intervals in Question 4.arrow_forward
 MATLAB: An Introduction with ApplicationsStatisticsISBN:9781119256830Author:Amos GilatPublisher:John Wiley & Sons Inc
 Probability and Statistics for Engineering and th...StatisticsISBN:9781305251809Author:Jay L. DevorePublisher:Cengage Learning
 Statistics for The Behavioral Sciences (MindTap C...StatisticsISBN:9781305504912Author:Frederick J Gravetter, Larry B. WallnauPublisher:Cengage Learning
 Elementary Statistics: Picturing the World (7th E...StatisticsISBN:9780134683416Author:Ron Larson, Betsy FarberPublisher:PEARSON
 The Basic Practice of StatisticsStatisticsISBN:9781319042578Author:David S. Moore, William I. Notz, Michael A. FlignerPublisher:W. H. Freeman
 Introduction to the Practice of StatisticsStatisticsISBN:9781319013387Author:David S. Moore, George P. McCabe, Bruce A. CraigPublisher:W. H. Freeman