
Videos
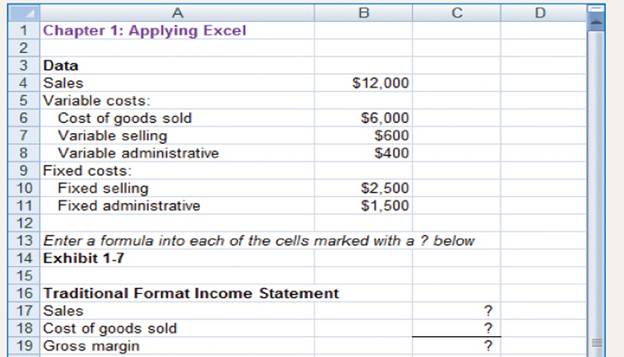
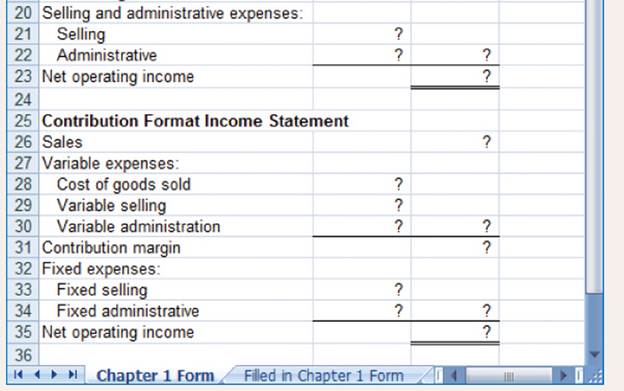
This Excel worksheet form is to be used to recreate Exhibit 1-7. Download the workbook containing this form from Connect, where you will also receive instructions.
2. Suppose that sales are 10% higher as shown below: 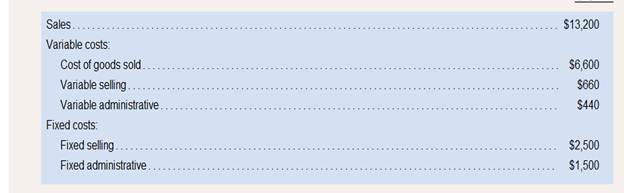
Enter this new data into your worksheet. Make sure that you change all of the data that are different-not just the sales. Print or copy the income statements from your worksheet.
What happened to the variable costs and to the fixed costs when sales increased by 10%? Why? Did the contribution margin increase by 10%? Why or why not? Did the net operating income increase by 10%? Why or why not?
Variable cost, fixed cost, contribution margin, net operating income:
Variable costs are directly related with production process, so it has the changes according to the sales revenue.
Fixed costs are indirectly related with production process, so it hasn’t change according to the sales revenue.
Contribution income is derived after deducting variable costs from sales revenue.
Net operating income is the real income for the company because it has derived after deduction all costs such as variable and fixed costs from sales revenue.
Whether increase of sales by 10% would change the variable costs and fixed costs.
Whether contribution margin increased or not by the new sales revenue (10%).
Whether net operating income increased or not by new sales revenue (10%).
Answer to Problem 2AE
Solution:
| Traditional format income statement |
|
|
| Particulars | Amount | Amount |
| Sales revenue | $13,200 | |
| Less | ||
| Cost of goods sold | $6,600 | |
| Gross margin | $6,600 | |
| Less: Selling and administration expenses | ||
| Selling expenses | $3160 | |
| Administration expenses | $1940 | $5100 |
| Net operating income | $1,500 |
| Contribution Format income statement | ||
| Particulars | Amount | Amount |
| Sales revenue | $13,200 | |
| Less: Variable expenses | ||
| Cost of goods sold | $6600 | |
| Variable selling | $660 | |
| Variable administration | $440 | $7,700 |
| Contribution margin | $5,500 | |
| Less: Fixed expenses | ||
| Selling expenses | $2,500 | |
| Administration Expenses | $1,500 | $4,000 |
| Net operating income | $1,500 |
Formula:
Explanation of Solution
Yes, new sales revenue increased the variable cost by 10%.
Old variable cost:
Increase variable cost:
New variable cost:
Yes, contribution margin increased by 10% due to new sales revenue, new variable costs, if variable
cost has change it reflect the contribution margin.
No, net operating income not increased by 10%, because fixed cost remain unchanged made the net
income increased up to 50%.
Old net operating income:
New net operating income:
Above explanation and calculation stated new sales revenue increased variable cost not the fixed cost and contribution margin also increased by 10% but net operating income not increased by 10%.
Want to see more full solutions like this?
Chapter 1 Solutions
INTRO. TO MANAG. ACCT. W/CONNECT >IB<


- The controller for Dohini Manufacturing Company felt that the number of purchase orders alone did not explain the monthly purchasing cost. He knew that nonstandard orders (for example, one requiring an overseas supplier) took more time and effort. He collected data on the number of nonstandard orders for the past 12 months and added that information to the data on purchasing cost and total number of purchase orders. Multiple regression was run on the above data; the coefficients shown by the regression program are: Required: 1. Construct the cost formula for the purchasing activity showing the fixed cost and the variable rate. 2. If Dohini Manufacturing Company estimates that next month will have 430 total purchase orders and 45 nonstandard orders, what is the total estimated purchasing cost for that month? (Round your answer to the nearest dollar.) 3. What if Dohini Manufacturing wants to estimate purchasing cost for the coming year and expects 5,340 purchase orders and 580 nonstandard orders? What will estimated total purchasing cost be? What is the total fixed purchasing cost? Why doesnt it equal the fixed cost calculated in Requirement 2? (Round your answers to the nearest dollar.)arrow_forwardSalem Electronics currently produces two products: a programmable calculator and a tape recorder. A recent marketing study indicated that consumers would react favorably to a radio with the Salem brand name. Owner Kenneth Booth was interested in the possibility. Before any commitment was made, however, Kenneth wanted to know what the incremental fixed costs would be and how many radios must be sold to cover these costs. In response, Betty Johnson, the marketing manager, gathered data for the current products to help in projecting overhead costs for the new product. The overhead costs based on 30,000 direct labor hours follow. (The high-low method using direct labor hours as the independent variable was used to determine the fixed and variable costs.) All depreciation. The following activity data were also gathered: Betty was told that a plantwide overhead rate was used to assign overhead costs based on direct labor hours. She was also informed by engineering that if 20,000 radios were produced and sold (her projection based on her marketing study), they would have the same activity data as the recorders (use the same direct labor hours, machine hours, setups, and so on). Engineering also provided the following additional estimates for the proposed product line: Upon receiving these estimates, Betty did some quick calculations and became quite excited. With a selling price of 26 and just 18,000 of additional fixed costs, only 4,500 units had to be sold to break even. Since Betty was confident that 20,000 units could be sold, she was prepared to strongly recommend the new product line. Required: 1. Reproduce Bettys break-even calculation using conventional cost assignments. How much additional profit would be expected under this scenario, assuming that 20,000 radios are sold? 2. Use an activity-based costing approach, and calculate the break-even point and the incremental profit that would be earned on sales of 20,000 units. 3. Explain why the CVP analysis done in Requirement 2 is more accurate than the analysis done in Requirement 1. What recommendation would you make?arrow_forwardOpen MFG2 and click the Chart sheet tab. The management of Twisp is convinced that the quality of its products is highly dependent on their relative labor costs. Experience has shown that direct labor should account for at least 45% of the total product cost. According to the pie chart that appears on the screen, Twisp did not achieve this goal in 2011. How much should Twisp have spent on direct labor to reach its 45% goal? To find out, try different values for direct labor (cell C8), clicking the Chart sheet tab after each attempt. When you find a direct labor level that increases the direct labor percentage to 45%, enter the answer in the space provided: In 2011, direct labor needed to be ________________. Open MFG3 and click the Chart sheet tab. Did Twisp achieve its 45% goal in 2012? If not, answer the following: In 2012, direct labor needed to be ________________. When the assignment is complete, close the files without saving them again. Worksheet. The MFG2 worksheet presents the companys manufacturing activities for 2011. The company also had the following selling and general activities in 2011: sales of 13,503,000, selling expenses of 2,400,000, and general expenses of 1,200,000. Modify the worksheet to include this information in the Data Section and change the Answer Section so that it is in the form of an income statement. Preview the printout to make sure that the worksheet will print neatly on one page, and then print the worksheet. Save the completed file as MFGT. Hint: Expand the Data Section to include these additional input items alphabetically. Insert a row for sales under the heading in the Answer Section. Add the rest of the income statement information to the bottom of the schedule. You will need to enter formulas for gross profit, all the expenses, and net income. You will also need to change the statement name. Chart. Using the MFG2 file, prepare a single 3-D bar chart to show the dollar amount of materials, labor, and overhead incurred by Twisp in 2011 and 2012. Complete the Chart Data Table and use it as a basis for preparing the chart. Enter all appropriate titles, legends, and formats. Enter your name somewhere on the chart. Save the file again as MFG2. Print the chart.arrow_forward
- The controller of Emery, Inc. has computed quality costs as a percentage of sales for the past 5 years (20X1 was the first year the company implemented a quality improvement program). This information is as follows: Required: 1. Prepare a trend graph for total quality costs. Comment on what the graph has to say about the success of the quality improvement program. 2. Prepare a graph that shows the trend for each quality cost category. What does the graph have to say about the success of the quality improvement program? Does this graph supply more insight than the total cost trend graph does? 3. Prepare a graph that compares the trend in relative control costs versus relative failure costs. Comment on the significance of this trend.arrow_forwardTom uses his computer to calculate the following regression formula:Weekly total costs = $18,791 + ($19.97 * Number of orders per week) Draw the regression line on your graph. Use your graph to evaluate the regression line using the criteria of economic plausibility, goodness of fit, and significance of the independent variable. Is the cost function estimated using the high-low method a close approximation of the cost function estimated using the regression method? Explain briefly.arrow_forwardI have submitted the same question twice and it has been resolved two different times with different results. Could you please have a look again into this? Jaime Ltd manufactures and sells a small electric product to order for the computer industry. The estimated selling price and variable costs per unit for next year are as follows: (£ per unit) Selling price 654.00 Variable costs: Direct materials 216.00 Direct labour 108.00 Production overhead 54.00 Selling & distribution overhead 27.00 Jaime Ltd expects to sell 108,000 units next year. Jaime Ltd expects the stock level at the start of the year to be NIL and the stock at the end of the year to be 18,000 units. Information on fixed costs is as follows: Fixed costs: £ Production overhead 1,452,000 Selling & distribution 360,000 Administration overhead 342,000…arrow_forward
- To help in the analysis, Kaylin gathered the following data for LLHC for 20X1: Tons sold: 10 Average cartons per shipment: 2 Average shipments per ton: 7 1) Using the new costs computed in Requirement 2, compute the profit per ton of LLHC. Compare this with the profit per ton computed by using the old method. Do you think that this same effect would be realized for other low-volume products? Explain.arrow_forwardCan someone help me with part B of this problem?: Verasource Microprocessor Corporation sells 200 computer chips a month for $1,500 each. variable costs are $1,500,000. Fixed costs are $500,000. there's a defect rate of 8%. What is the hidden cost to the company of making this rate of defectives instead of 2,000 good chips each month? Suppose a six sigma effort can reduce the defects to a six sigma level. what is the impact on profitability?arrow_forward1. Now change all of the dollar amounts in the data area of your worksheet so that it looks like this: Chapter 1: Applying Excel Data Sales $59,500 Variable costs: Cost of goods sold $34,000 Variable selling $3,400 Variable administrative $3,200 Fixed costs: Fixed selling $2,500 Fixed administrative $1,500 If your formulas are correct, you should get the correct answers to the following questions. (a) What is the gross margin now? (b) What is the net operating income now? (c) What is the contribution margin now?arrow_forward
- A small company manufactures a certain item and sells it online. The company has a business model where the cost, C in dollars, to make x items is given by the equation C = 20/3 x + 50. The revenue R , in dollars , made by selling x items is given by the equation R = 10x. How many items must the company sell in order for the cost to equal their revenue?arrow_forwardI initially did this using a differential analysis, but it seems like the project wants me to do it a different way (see the attached worksheet). What am I supposed to enter in the blue boxes? I can understand why the special order should be accepted or not. The minimum price per unit I got to was $5.87. I don't know how to do part a) or b) according the the worksheet attached otherwise. Can you show the formulas too to see how to do it? The following total cost data are for Ralston Manufacturing Company, which has a normal capacity per period of 400,000 units of product that sell for $18 each. For the foreseeable future, regular sales volume should continue at normal capacity of production. Direct Materials $1,720,000 Direct Labor 1,120,000 Variable overhead 560,000 Fixed overhead (Note 1) 880,000 Selling expenses (Note 2) 720,000 Administrative expense (fixed) 200,000 5,200,000 Notes: 1. Beyond normal capacity, fixed overhead cost increases $30,000…arrow_forwardRockness asked, "Do you see any problems here? Should we drop any of these products? Should we reprice any of these products?" He said, "I am suspicious of these cost data, Rocky. Here we are assigning indirect costs to these products using a 260 percent rate. I really wonder whether that rate is accurate for all products. I want you to dig into the indirect cost data, figure out what drives those costs, and see whether you can give me more accurate cost numbers for these products." Rocky first learned from production that the process required four activities: (1) setting up production runs, (2) managing production runs, and (3) managing products. The fourth activity did not require labor; it was simply the operation of machinery. Next, he went to the accounting records to get a breakdown of indirect costs. Here is what he found: ---------------------------------------------------IMAGE 2----------------------------------------------------------------- Then, he began a series of…arrow_forward
 Managerial Accounting: The Cornerstone of Busines...AccountingISBN:9781337115773Author:Maryanne M. Mowen, Don R. Hansen, Dan L. HeitgerPublisher:Cengage Learning
 Excel Applications for Accounting PrinciplesAccountingISBN:9781111581565Author:Gaylord N. SmithPublisher:Cengage Learning
 Cornerstones of Cost Management (Cornerstones Ser...AccountingISBN:9781305970663Author:Don R. Hansen, Maryanne M. MowenPublisher:Cengage Learning