
Introduction To Statistics And Data Analysis
6th Edition
ISBN: 9781337793612
Author: PECK, Roxy.
Publisher: Cengage Learning,
expand_more
expand_more
format_list_bulleted
Concept explainers
Videos
Textbook Question
Chapter 1, Problem 38CR
Many adolescent boys aspire to be professional athletes. The paper “Why Adolescent Boys Dream of Becoming Professional Athletes” (Psychological Reports [1999]:1075–1085) examined some of the reasons. Each boy in a sample of teenage boys was asked the following question: “Previous studies have shown that more teenage boys say that they are considering becoming professional athletes than any other occupation. In your opinion, why do these boys want to become professional athletes?” The resulting data are shown in the following table:
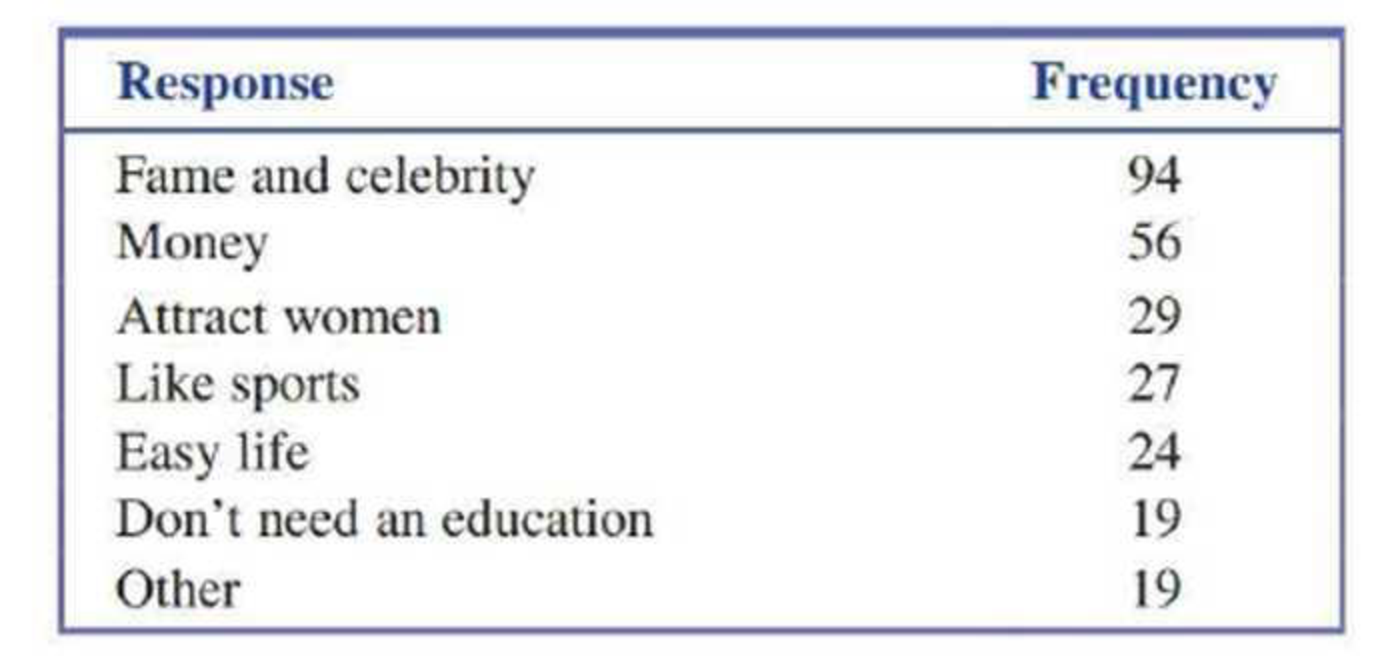
Construct a bar chart to display these data.
Expert Solution & Answer
Want to see the full answer?
Check out a sample textbook solution
Students have asked these similar questions
A sample of men and women who had passed their driver's test either the first time or the second time were surveyed, with the following results:
Results of the driving testGender First time Second timeMen 126 211Women 135 178a) Do these data suggest that there is a relationship between gender and the passing of their driver’s test from which the present sample was drawn? Let alpha=.05
A cross-sectional study is conducted to investigate cardiovascular disease (CVD) risk factors among a sample of patients seeking medical care at one of three local hospitals. A total of 500500 patients are enrolled. Based on the following data, we would like to determine if there is a significant association between the family history of CVD and the enrollment site.
Enrollment Site
Family History of CVD
Hospital 1
Hospital 2
Hospital 3
Total
Yes
34
8
58
100
No
104
72
224
400
Total
138
80
282
500
Given:
The value of the test statistic is χ2= 6.912
Use α=0.1 as the level of significance.
The superintendent of Hospital 2 performed the Goodness of Fit Test to test whether 25% of the patients go to Hospital 1, 15% of the patients go to Hospital 2 and 60% of the patients go to Hospital 3.
Given: The superintendent found that the pp-value for the test is 0.25091
Let:
p1=p1= be the proportion of patients at Hospital 1
p2=p2= be the proportion of patients at…
A paper investigated the driving behavior of teenagers by observing their vehicles as they left a high school parking lot and then again at a site approximately
1
2
mile from the school. Assume that it is reasonable to regard the teen drivers in this study as representative of the population of teen drivers.
MaleDriver
FemaleDriver
1.3
-0.3
1.3
0.6
0.9
1.1
2.1
0.7
0.7
1.1
1.3
1.2
3
0.1
1.3
0.9
0.6
0.5
2.1
0.5
(a) Use a .01 level of significance for any hypothesis tests. Data consistent with summary quantities appearing in the paper are given in the table. The measurements represent the difference between the observed vehicle speed and the posted speed limit (in miles per hour) for a sample of male teenage drivers and a sample of female teenage drivers. (Use ?males − ?females. Round your test statistic to two decimal places. Round your degrees of freedom down to the nearest whole number. Round your p-value to three decimal places.)
t
=
df
=…
Chapter 1 Solutions
Introduction To Statistics And Data Analysis
Ch. 1.3 - Give brief definitions of the terms descriptive...Ch. 1.3 - Give brief definitions of the terms population and...Ch. 1.3 - The following conclusion from a study appeared in...Ch. 1.3 - Based on a study of 2 121 children between the...Ch. 1.3 - The student senate at a university with 15,000...Ch. 1.3 - The National Retail Federation used data from a...Ch. 1.3 - The supervisors of a rural county are interested...Ch. 1.3 - A consumer group conducts crash tests of new model...Ch. 1.3 - A building contractor has a chance to buy an odd...Ch. 1.3 - The article Brain Shunt Tested to Treat Alzheimers...
Ch. 1.3 - In a study of whether taking a garlic supplement...Ch. 1.4 - Classify each of the following variables as either...Ch. 1.4 - Classify each of the following variables as either...Ch. 1.4 - For the following numerical variables, state...Ch. 1.4 - For the following numerical variables, state...Ch. 1.4 - For each of the following situations, give a set...Ch. 1.4 - In a survey of 100 people who had recently...Ch. 1.4 - The Gallup report More Americans Say Real Estate...Ch. 1.4 - An article in the New Times San Luis Obispo...Ch. 1.4 - Box Office Mojo (boxofficemojo.com) tracks movie...Ch. 1.4 - The report With Their Whole Lives Ahead of Them...Ch. 1.4 - The following display is a graph similar to one...Ch. 1.4 - The accompanying table gives the total number...Ch. 1.4 - Heal the Bay is an environmental organization that...Ch. 1.4 - The report referenced in the previous exercise...Ch. 1.4 - The U.S. Department of Health and Human Services...Ch. 1.4 - Example 1.5 gave the accompanying data on violent...Ch. 1.4 - The article Fliers Trapped on Tarmac Push for...Ch. 1.4 - The report Trends m Community Colleges...Ch. 1.4 - The article Where College Students Buy Textbooks...Ch. 1.4 - Prob. 31ECh. 1.4 - In the United States, movies are rated by the...Ch. 1 - The report Testing the Waters 2009 (nrdc.org)...Ch. 1 - The U.S. Department of Education reported that 14%...Ch. 1 - The Computer Assisted Assessment Center at the...Ch. 1 - The article Just How Safe Is That Jet? (USA TODAY,...Ch. 1 - Each year, U.S. News and World Report publishes a...Ch. 1 - Many adolescent boys aspire to be professional...
Knowledge Booster


Learn more about
Need a deep-dive on the concept behind this application? Look no further. Learn more about this topic, statistics and related others by exploring similar questions and additional content below.Similar questions
- A paper investigated the driving behavior of teenagers by observing their vehicles as they left a high school parking lot and then again at a site approximately 1 2 mile from the school. Assume that it is reasonable to regard the teen drivers in this study as representative of the population of teen drivers. MaleDriver FemaleDriver 1.4 -0.2 1.2 0.5 0.9 1.1 2.1 0.7 0.7 1.1 1.3 1.2 3 0.1 1.3 0.9 0.6 0.5 2.1 0.5 (a) Use a .01 level of significance for any hypothesis tests. Data consistent with summary quantities appearing in the paper are given in the table. The measurements represent the difference between the observed vehicle speed and the posted speed limit (in miles per hour) for a sample of male teenage drivers and a sample of female teenage drivers. (Use ?males − ?females. Round your test statistic to two decimal places. Round your degrees of freedom down to the nearest whole number. Round your p-value to three decimal places.) t = df =…arrow_forwardThe following data are obtained from a study that seeks to investigate theeffects of an intervention program and the extent of their physical disability on their reading, math and IQ scores. The students who had been recipients of an intervention program are in the treatment group and while those who are not are in the control group. Questions:1. Is there a significant difference in the math, reading and IQ scores ofstudents in the treatment and controlgroups?2. Is the intervention program effective?3. Is there a significant difference in the math, reading and IQ scores ofstudentswhen they are grouped according to the extent of their physicaldisability?4. Isthereasignificantinteractionbetweentreatmentandextentofdisabilityonthe students’ reading, math and IQscores?arrow_forwardDowns and Abwender (2002) evaluated soccer players and swimmers to determine whether the routine blows to the head experienced by soccer players produced long term neurological deficits. In the study, neurological tests were administered to mature soccer players and swimmers and the results indicated significant differences. In a similar study, a researcher obtained the following data. Swimmers Soccer Players 10 7 8 4 7 9 9 3 13 7 7 6 12 a)Are the neurological test scores significantly lower for the soccer player than for the swimmers in the control groups? Use a one-tailed test with = .05. b)Compute the value of r² (percentage of variance accounted for) these data.arrow_forward
- A doctor would like to evaluate whether flu-frequency is different among patients of various ages. He groups his most recent 12 patients into four groups according to age (pediatric, young adult, older adult, senior), and counts the frequency of their flu-related visits. Below is his data. Test the hypothesis that flu frequency is different among pediatric, adult, older adult, and senior patients using an alpha level of .01. Pediatric. Young Adult. Older Adult. Senior 6 2 4 7 4 1 0 9 5 0 0 12 a. What test is appropriate? b. State your null hypothesis: c. State your alternative hypothesis. d. Find the critical value:…arrow_forwardA Canadian study measuring depression level in teens (as reported in the Journal of Adolescence, vol. 25, 2002) randomly sampled 112 male teens and 101 female teens, and scored them on a common depression scale (higher score representing more depression). The researchers suspected that the mean depression score for male teens is higher than for female teens, and wanted to check whether data would support this hypothesis. If μ1 and μ2 represent the mean depression score for male teens and female teens respectively, which of the following is an appropriate pair of hypotheses in this case? Check all that apply.arrow_forwardA consumer advocacy group wanted to study whether different airline carriers differed in terms of their delayed flights. In particular, the researchers were interested in the relationship between p1, the proportion of Alpha Airlines flights that were delayed at least 15 minutes, and p2, the proportion of Beta Airlines flights that were delayed at least 15 minutes. A random sample of 1,000 Alpha flights and a separate random sample of 1,000 Beta flights found that 67 of the Alpha fights and 160 of the Beta flights were delayed at least 15 minutes. The conditions for inference were checked and verified. Does this set of samples provide strong evidence that Alpha Airlines has a smaller proportion of flights that are delayed at least 15 minutes than Beta Airlines, at the α = 0.05 significance level? Find the z-table here. A. The test statistic is z = –6.56 and the P-value ≈ 0. Since the P-value ≈ 0 < 0.05, there is not sufficient evidence that Alpha Airlines has fewer delayed…arrow_forward
- In a study of a group of women science majors who remained in their profession and a group who left their profession within a few months of graduation, the researchers collected the data shown here on a self-esteem questionnaire. Leavers Stayers1 = 3.05 2 = 2.92σ1 = 0.71 σ2 = 0.71n1 = 100 n2 = 227At α = 0.05, can it be concluded that there is a difference in the self-esteem scores of the two groups? Use the P-value method.arrow_forwardA doctor would like to evaluate whether flu-frequency is different among patients of various ages. He groups his most recent 12 patients into four groups according to age (pediatric, young adult, older adult, senior), and counts the frequency of their flu-related visits. Below is his data. Test the hypothesis that flu frequency is different among pediatric, adult, older adult, and senior patients using an alpha level of .01. Pediatric. Young Adult. Older Adult. Senior 6 2 4 7 4 1 0 9 5 0 0 12 g. What does your decision mean? h. Paste your SPSS output here: i. Explain how the Sig. value in your SPSS output leads you to…arrow_forwardA study was performed on 200 elementary school students to investigate whether regular Vitamin A supplementation was effective in preventing colds during the month of March. 100 were randomized to receive daily Vitamin A supplements during the month of March, and 100 students were randomized to a placebo group (and did not receive Vitamin A) during the same month. The number of students getting at least one cold in March was computed in the two groups, and the results are given in the following 2 X 2 table. Using a 5% level of significance determine whether there is an association between Vitamin A supplementation and prevention of Common Cold ColdNo Cold Vitamin A1585100 Placebo2575100 40160200arrow_forward
- In a study designed to test the effectiveness of hypnosis in reducing pain a research team looked at responses from 8 randomly selected patients before and after hypnosis. The raw data are found in Table 1. Let ? = 0.01 Table 1: Perceived pain levels pre and post hypnosis for 8 subjects Pre 9.6 11.3 10.6 8.5 9.8 12.8 10.8 12.2 Post 9.3 11.0 8.5 10.0 10.2 9.4 8.9 11.5 Diff -0.3 -0.3 -2.1 1.5 0.4 -3.4 -1.9 -0.7 E) The point estimate for the true standard deviation of the effect that hypnosis has on pain perception is: Note: round your answer to 3 decimal precision G) The test statistic for this data set is: Note: Round your answer to the nearest hundredth.arrow_forwardA U.S. Food Survey showed that Americans routinely eat beef in their diet. Suppose that in a study of 49 consumers in Illinois and 64 consumers in Texas the following results were obtained from two samples regarding average yearly beef consumption: Illinois Texas = 49 = 64 = 54.1lb = 60.4lb S1 = 7.0 S2 = 8.0 Formulate a hypothesis so that, if the null hypothesis is rejected, we can conclude that the average amount of beef eaten annually by consumers in Illinois is significantly less than that eaten by consumers in Texas.arrow_forwardIn its January 25, 2012, issue, the Journal of the American Medical Association reported on the effects of overconsumption of low, normal, and high protein diets on weight gain, energy expenditure, and body composition. Researchers conducted a single blind, randomized controlled trial of 25 U.S. adults. The subjects were healthy, weight-stable, male and female volunteers, aged 18 to 35 years. All subjects consumed a weight-stabilizing diet for 13 to 25 days. Afterwards, the researchers randomly assigned participants to diets containing various percentages of energy from protein: 5% (low protein), 15% (normal protein), or 25% (high protein). The subjects were not aware of the specific protein level diet to which they were assigned. On these diets the researchers overfed the participants during the last 8 weeks of their 10 to 12 week stay in the inpatient metabolic unit. The goal was to investigate the effect of overconsumption of protein on weight gain, energy expenditure, and body…arrow_forward
arrow_back_ios
SEE MORE QUESTIONS
arrow_forward_ios
Recommended textbooks for you
 Holt Mcdougal Larson Pre-algebra: Student Edition...AlgebraISBN:9780547587776Author:HOLT MCDOUGALPublisher:HOLT MCDOUGAL
Holt Mcdougal Larson Pre-algebra: Student Edition...
Algebra
ISBN:9780547587776
Author:HOLT MCDOUGAL
Publisher:HOLT MCDOUGAL
Sampling Methods and Bias with Surveys: Crash Course Statistics #10; Author: CrashCourse;https://www.youtube.com/watch?v=Rf-fIpB4D50;License: Standard YouTube License, CC-BY
Statistics: Sampling Methods; Author: Mathispower4u;https://www.youtube.com/watch?v=s6ApdTvgvOs;License: Standard YouTube License, CC-BY