
Introduction To Statistics And Data Analysis
6th Edition
ISBN: 9781337793612
Author: PECK, Roxy.
Publisher: Cengage Learning,
expand_more
expand_more
format_list_bulleted
Concept explainers
Videos
Textbook Question
Chapter 1.4, Problem 29E
The report “Trends m Community Colleges” (collegeboard.com/trends April 2106, trends .collegeboard.org/sites/default/files/trends-in-community-colleges-research-brief.pdf, retreived February 8, 2018) included the accompanying information on student debt for students graduating with an AA degree from a public community college in 2012.
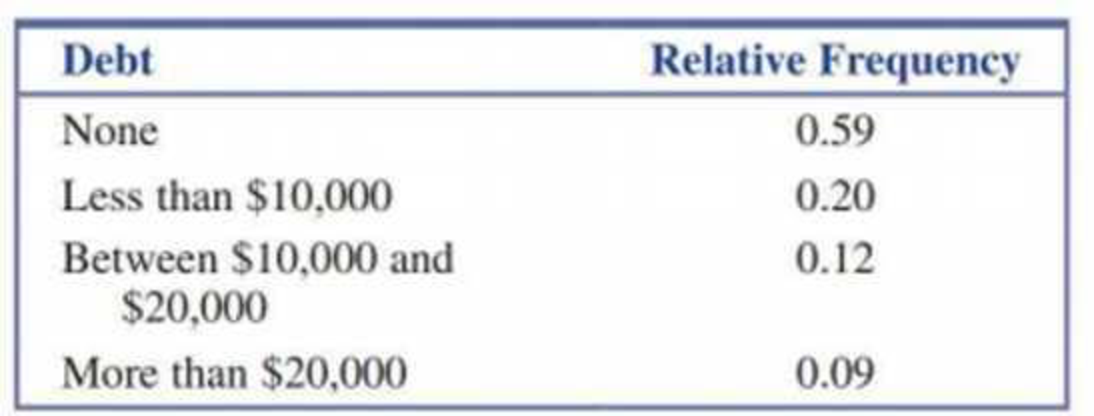
- a. Use the given information to construct a bar chart.
- b. Write a few sentences commenting on student debt for public community college graduates.
Expert Solution & Answer
Want to see the full answer?
Check out a sample textbook solution
Students have asked these similar questions
In January 2019, a small company headquartered in Baltimore needed to track its cost per employee in 2018 for tax purposes. The company had 98 employees at the time. The CFO prepares a chart listing the name of each employee along with his or her salary, total amount of any
bonuses received, health insurance cost, whether the employee is participating in Car efirst or Kaiser, the company’s 401K contribution and
whether the employee took any college courses in 2018 (1 for yes, 0 for no.)
(a) How many cases are there?
(b) How many variables are there?
(c) Give the W’s.
(d) Tell whether each variable is categorical or quantitative.
(e) For quantitative variables, give the units.
The Bank of Canada is interested in studying the relationship between mortgage rates and medianhome prices. The data is provided belowYear interest rate (%) Median home price1988 10.30 $183,8001989 10.30 $183,2001990 10.10 $174,9001991 9.30 $173,5001992 8.40 $172,9001993 7.30 $173,2001994 8.40 $173,2001995 7.90 $169,7001996 7.60 $174,5001997 7.60 $177,9001998 6.90 $188,1001999 7.40 $203,2002000 8.10 $230,2002001 7.00 $258,2002002 6.50 $309,8002003 5.80 $329,8002004 5.80 $431,0002005 5.80 $515,0002006 6.40 $537,0002007 6.30 $496,0002008 6.00 $352,0002009 5.00 $232,0002010 4.70 $291,7002011 4.40 $262,9002012 3.60 $299,2002013 4.00 $321,2002014 4.10 $373,5002015 3.80 $358,1002016 3.60 $382,5002017 4.00 $402,900a) Estimate a simple linear regression model and find the value of the parameters for theestimation of mortgage rates and the median home price. All JASP input files and outputtables should be provided. Interpret the intercept and the slope coefficientsb) State the correlation…
Rank
Player
Money ($)
Scoring Average
DrDist
DrAccu
GIR
1
Vijay Singh
6,601,094
70.27
297.8
59.45
68.45
2
Phil Mickelson
5,188,875
70.28
295.7
55.27
65.81
3
Sergio Garcia
4,858,224
70.6
294.6
59.39
67.06
4
Kenny Perry
4,663,794
70.21
296
61.97
67.47
5
Anthony Kim
4,656,265
70.22
300.9
58.34
65.78
6
Camilo Villegas
4,422,641
70.6
293.3
58.15
64.6
7
Padraig Harrington
4,313,551
70.7
296.3
59.37
60.67
8
Stewart Cink
3,979,301
70.65
296.9
55.27
66.94
9
Justin Leonard
3,943,542
70.41
281.4
67.72
66.61
10
Robert Allenby
3,606,700
70.64
291.7
65.64
70.4
11
Jim Furyk
3,455,714
70.56
280.4
69.37
66.78
12
Ryuji Imada
3,029,363
71.13
278.6
59.64
61.39
13
Mike Weir
3,020,135
70.68
284.8
62.46
64.62
14
Geoff Ogilvy
2,880,099
71.38
292.1
58.18
61.89
15
K.J. Choi
2,683,442
71.01
286.1
61.38
65.48
16
Ben Curtis
2,615,798
70.96
284.7
67.2
63.45
17
Kevin Sutherland
2,581,311
70.22
291
61.93
68.2
18
Trevor Immelman
2,566,199
71.85
291.3
62.45
63.07
19
Ernie Els…
Chapter 1 Solutions
Introduction To Statistics And Data Analysis
Ch. 1.3 - Give brief definitions of the terms descriptive...Ch. 1.3 - Give brief definitions of the terms population and...Ch. 1.3 - The following conclusion from a study appeared in...Ch. 1.3 - Based on a study of 2 121 children between the...Ch. 1.3 - The student senate at a university with 15,000...Ch. 1.3 - The National Retail Federation used data from a...Ch. 1.3 - The supervisors of a rural county are interested...Ch. 1.3 - A consumer group conducts crash tests of new model...Ch. 1.3 - A building contractor has a chance to buy an odd...Ch. 1.3 - The article Brain Shunt Tested to Treat Alzheimers...
Ch. 1.3 - In a study of whether taking a garlic supplement...Ch. 1.4 - Classify each of the following variables as either...Ch. 1.4 - Classify each of the following variables as either...Ch. 1.4 - For the following numerical variables, state...Ch. 1.4 - For the following numerical variables, state...Ch. 1.4 - For each of the following situations, give a set...Ch. 1.4 - In a survey of 100 people who had recently...Ch. 1.4 - The Gallup report More Americans Say Real Estate...Ch. 1.4 - An article in the New Times San Luis Obispo...Ch. 1.4 - Box Office Mojo (boxofficemojo.com) tracks movie...Ch. 1.4 - The report With Their Whole Lives Ahead of Them...Ch. 1.4 - The following display is a graph similar to one...Ch. 1.4 - The accompanying table gives the total number...Ch. 1.4 - Heal the Bay is an environmental organization that...Ch. 1.4 - The report referenced in the previous exercise...Ch. 1.4 - The U.S. Department of Health and Human Services...Ch. 1.4 - Example 1.5 gave the accompanying data on violent...Ch. 1.4 - The article Fliers Trapped on Tarmac Push for...Ch. 1.4 - The report Trends m Community Colleges...Ch. 1.4 - The article Where College Students Buy Textbooks...Ch. 1.4 - Prob. 31ECh. 1.4 - In the United States, movies are rated by the...Ch. 1 - The report Testing the Waters 2009 (nrdc.org)...Ch. 1 - The U.S. Department of Education reported that 14%...Ch. 1 - The Computer Assisted Assessment Center at the...Ch. 1 - The article Just How Safe Is That Jet? (USA TODAY,...Ch. 1 - Each year, U.S. News and World Report publishes a...Ch. 1 - Many adolescent boys aspire to be professional...
Knowledge Booster


Learn more about
Need a deep-dive on the concept behind this application? Look no further. Learn more about this topic, statistics and related others by exploring similar questions and additional content below.Similar questions
- Jensen Tire & Auto is in the process of deciding whether to purchase a maintenance contract for its new computer wheel alignment and balancing machine. Managers feel that maintenance expense should be related to usage, and they collected the following information on weekly usage (hours) and annual maintenance expense (in hundreds of dollars).arrow_forwardThe following table presents prices, in thousands of dollars, of single-family homes for 20 of the largest metropolitan areas in the United States for the first quarter of 2012 and the first quarter of 2013. . Metro Area 2012 2013 Boston, MA 311.5 332.2 Chicago, IL 157.2 159.4 Cincinnati, OH 112.5 121.0 Cleveland, OH 84.9 101.0 Dallas, TX 148.2 160.4 Denver, CO 226.4 261.2 Houston, TX 152.1 163.7 Los Angeles, CA 122.1 155.1 Miami, FL 182.0 219.9 Minneapolis, MN 147.3 170.6 Metro Area 2012 2013 New York, NY 363.8 368.2 Philadelphia, PA 193.5 197.7 Phoenix, AZ 129.9 169.0 Portland, OR 208.6 246.5 Riverside, CA 174.3 216.7 St. Louis, MO 103.7 111.0 San Diego, CA 359.5 412.3 San Francisco, CA 448.0…arrow_forward) Consider the following figures showing the situation of the Australian labourmarket in 2018 (figures are per thousand and in percentage).Employed persons ('000) 12 620.7Unemployed persons ('000) 711.9Unemployment rate (%) 5.4Participation rate (%) 65.6a. What is the labour force participation rate? Briefly checking some online sources is it lower or higherthan in other countries? Try to provide some explanation for the difference.b. Assume that the participation rate in Australia changes to 63%, but the adult population and the numberof employed remain unchanged (hint: if the adult population is not reported, you can calculate it easilyfrom the labour force and participation rate). What would be the labour force, the number ofunemployed, and the unemployment rate?c. Go to the latest LFS by the ABS at: www.abs.gov.au/ausstats/abs@.nsf/mf/6202.0. How does the currentsituation compare with 2018? Spend about 10 minutes going through the website and report at least oneobservation you find…arrow_forward
- The following table shows the number of siblings and daily allowance of 12 students from a Grade 11 class:arrow_forwardA credit report has the following accounts open with the balance, credit limit, and duration of time each account has been open. Car Loan 3 Years 4 Months Credit Card 1 1 Month Balance: $500 Limit: $1000 Credit Card 2 4 Years 11 Months Balance: $500 Limit: $10,000 Credit Card 3 2 Years 2 Months Balance: $4500 Limit: $5000 Calculate the average credit age. Group of answer choicesarrow_forwardAccording to the research on marital dissolution (break-up), what value orientation is the most common for those countries where divorce rates are highest?arrow_forward
- The following information is taken from Johnson & Johnson's annual reports. Its common stock is listed on the New York Stock Exchange, using the symbol JNJ. Johnson & Johnson Domestic Sales International Sales Employees Year ($ million) $ Million Thousands 2010 29,437 32,124 114.0 2011 12,907 36,107 117.9 2012 29,830 37,394 127.6 2013 31,910 39,402 128.1 2014 34,782 39,548 126.5 2015 35,687 34,387 127.1 2016 37,811 34,079 126.4 2017 39,863 36,597 134.0 2018 41,884 39,697 135.1 Using the period 2010–12 as the base period, compute a simple index of international sales for each year from 2013 to 2018. (Round your answers to 1 decimal place.)The index (2010–2012 = 100) for selected years is: Year Index 2010 2011 2012 2013 2014 2015 2016 2017 2018 I have asked this question a few times and it hasn't been correct. I am very confused on this on. Also, am I putting anything for the…arrow_forwardThe following information is taken from Johnson & Johnson's annual reports. Its common stock is listed on the New York Stock Exchange, using the symbol JNJ. Johnson & Johnson Domestic Sales International Sales Employees Year ($ million) ($ million) (thousands) 2010 $ 29,437 $ 32,124 114.0 2011 12,907 36,107 117.9 2012 29,830 37,394 127.6 2013 31,910 39,402 128.1 2014 34,782 39,548 126.5 2015 35,687 34,387 127.1 2016 37,811 34,079 126.4 2017 39,903 36,587 134.0 2018 41,884 39,697 135.1 Using the period 2010–12 as the base period, compute a simple index of domestic sales for each year from 2013 to 2018. (Round your answers to 1 decimal place.)The index (2010–2012 = 100) for selected years is: Year Simple Index 2010 2011 2012 2013 2014 2015 2016 2017 2018arrow_forwardThe following information is taken from Johnson & Johnson's annual reports. Its common stock is listed on the New York Stock Exchange, using the symbol JNJ. Johnson & Johnson Domestic Sales International Sales Employees Year ($ million) ($ million) (thousands) 2010 $ 29,437 $ 32,124 114.0 2011 12,907 36,107 117.9 2012 29,830 37,394 127.6 2013 31,910 39,402 128.1 2014 34,782 39,548 126.5 2015 35,687 34,387 127.1 2016 37,811 34,079 126.4 2017 39,863 36,587 134.0 2018 41,884 39,697 135.1 Using the period 2010–12 as the base period, compute a simple index of international sales for each year from 2013 to 2018. (Round your answers to 1 decimal place.)The index (2010–2012 = 100) for selected years is:arrow_forward
- 2) A sample of single persons receiving social security payments revealed these monthly benefits: $965, $826, $699, $1,087, $880, $839, $1346, $820 and $965. How many observations are below the mode?arrow_forwardThe following table gives the prices of some food items in the base year and current year and the quantities sold in the base year and current year. Commodity 2000 2005 Price (K) Quantity Price (K) Quantity A B C 15 20 4 15 5 10 22 27 7 12 4 5 Compute the following price index numbers for 2005 from the above table: i. Laspeyre’s price index number ii. Paasche’s price index numberarrow_forwardA consumer watchdog organization is concerned about credit card debt. A survey of 10 young adults with credit card debt of more than $2,000 showed they paid an average of just over $100 per month against their balances. Listed below are the amounts each young adult paid last month. $110 $126 $103 $93 $99 $113 $87 $101 $109 $100arrow_forward
arrow_back_ios
SEE MORE QUESTIONS
arrow_forward_ios
Recommended textbooks for you
 MATLAB: An Introduction with ApplicationsStatisticsISBN:9781119256830Author:Amos GilatPublisher:John Wiley & Sons Inc
 Probability and Statistics for Engineering and th...StatisticsISBN:9781305251809Author:Jay L. DevorePublisher:Cengage Learning
 Statistics for The Behavioral Sciences (MindTap C...StatisticsISBN:9781305504912Author:Frederick J Gravetter, Larry B. WallnauPublisher:Cengage Learning
 Elementary Statistics: Picturing the World (7th E...StatisticsISBN:9780134683416Author:Ron Larson, Betsy FarberPublisher:PEARSON
 The Basic Practice of StatisticsStatisticsISBN:9781319042578Author:David S. Moore, William I. Notz, Michael A. FlignerPublisher:W. H. Freeman
 Introduction to the Practice of StatisticsStatisticsISBN:9781319013387Author:David S. Moore, George P. McCabe, Bruce A. CraigPublisher:W. H. Freeman
MATLAB: An Introduction with Applications
Statistics
ISBN:9781119256830
Author:Amos Gilat
Publisher:John Wiley & Sons Inc
Probability and Statistics for Engineering and th...
Statistics
ISBN:9781305251809
Author:Jay L. Devore
Publisher:Cengage Learning
Statistics for The Behavioral Sciences (MindTap C...
Statistics
ISBN:9781305504912
Author:Frederick J Gravetter, Larry B. Wallnau
Publisher:Cengage Learning
Elementary Statistics: Picturing the World (7th E...
Statistics
ISBN:9780134683416
Author:Ron Larson, Betsy Farber
Publisher:PEARSON
The Basic Practice of Statistics
Statistics
ISBN:9781319042578
Author:David S. Moore, William I. Notz, Michael A. Fligner
Publisher:W. H. Freeman
Introduction to the Practice of Statistics
Statistics
ISBN:9781319013387
Author:David S. Moore, George P. McCabe, Bruce A. Craig
Publisher:W. H. Freeman
Which is the best chart: Selecting among 14 types of charts Part II; Author: 365 Data Science;https://www.youtube.com/watch?v=qGaIB-bRn-A;License: Standard YouTube License, CC-BY