
Concept explainers
Videos
(Exercises 27–40) For each description of data, identify the W’s, name the variables, specify for each variable whether its use indicates that it should be treated as categorical or quantitative, and, for any quantitative variable, identify the units in which it was measured (or note that they were not provided).
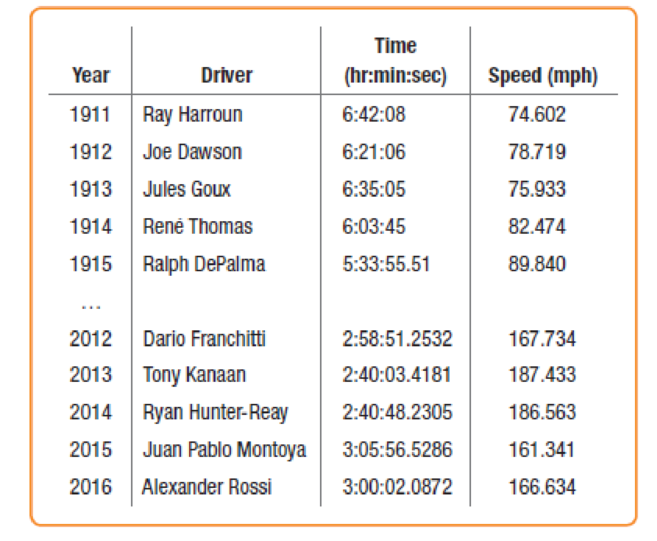
40. Indy 500 2016 The 2.5-mile Indianapolis Motor Speedway has been the home to a race on Memorial Day nearly every year since 1911. Even during the first race, there were controversies. Ralph Mulford was given the checkered flag first but took three extra laps just to make sure he’d completed 500 miles. When he finished, another driver, Ray Harroun, was being presented with the winner’s trophy, and Mulford’s protests were ignored. Harroun averaged 74.6 mph for the 500 miles. In 2013, the winner, Tony Kanaan, averaged over 187 mph, beating the previous record by over 17 mph!
Here are the data for the first five races and five recent Indianapolis 500 races.
Want to see the full answer?
Check out a sample textbook solution
Chapter 1 Solutions
Student's Solutions Manual For Intro Stats


- Farmers know that driving heavy equipment on wet soil compresses the soil and injures future crops. Here are data on the "penetrability" of the same type of soil at two levels of compression. Penetrability is a measure of how much resistance plant roots will meet when they try to grow through the soil. Compressed Soil: 2.85 3.082.6 2.822.95 2.782.82 2.982.76 3.002.81 2.782.78 2.963.08 2.902.94 3.182.86 3.16 Intermediate Soil: 3.13 3.543.32 3.363.1 3.183.40 3.123.38 3.863.14 2.923.18 3.463.26 3.442.96 3.623.02 4.26 Use the data, omitting the high outlier, to give a 96% confidence interval for the decrease in penetrability of compressed soil relative to intermediate soil. Compute degrees of freedom using the conservative method.Interval: Toarrow_forwardAn aerobic exercise instructor remembers the data given in the following table, which shows the recommended maximum exercise heart rates for individuals of the given ages. Predict the maximum exercise heart rate of a person who is 72 years old Age (x years) 20 30 40 50 60 Maximum heart rate (y beats per minute) 170 168 153 147 136arrow_forwardsection 4.1 #30 In Exercises 25–30, determine whether the association between the two variables is positive or negative. Weekly ice cream sales and weekly average temperaturearrow_forward
- Part c: What percentage of an adult size brain does a child have at age 10? Part d: Determine whether the value from the model is larger or smaller than the value in the table.arrow_forwardA fisherman has collected data about the length in inches, L, and weight in ounces, w, of fish he has caught. Use the data in the table below to construct an equation for the line of best fit to predict weight from length. Round to three decimal places. L 15 17 18 18 19 21 22 23 W 22 36 35 40 43 52 57 69 L=0.181+11.127w w=5.342−57.907L L=11.127+0.181w w=−57.907+5.342Larrow_forwardAt a peach packaging plant, 46,000 lbs of fresh peaches are processed and packed each hour. The table shows the diminishing inventory of peaches over the hour. Remaining peaches are sent to another part of the facility for canning. Peach Inventory Time, t(hours) Peaches, P(thousand pounds) 0 46 0.25 38 0.50 35 0.75 33 1.00 26 .(b) Use the model (not the table of data) to estimate how many peaches are left in inventory after half an hour. (c) Use the model (not the table of data) to estimate how many peaches will be sent to canning.arrow_forward
- Data were collected from libraries about the number of patrons who have overdue books and how long they have been using the library. Years Using Library 1 1 1.5 3 3.5 5 7 10 Number of Overdue Books 12 9 10 6 5 4 2 2 The equation ŷ = 12(0.81)x is a model that fits the data. Which of the following uses the model correctly and is an example of extrapolation? A patron who has been using the library for 2 years is predicted to have between 7 and 8 overdue books. A patron who has been using the library for 13 years is predicted to have between 6 and 7 overdue books. A patron who has been using the library for 2 years is predicted to have more than 94 overdue books. A patron who has been using the library for 13 years is predicted to have less than 1 overdue book.arrow_forwardPlease answer ASAP Economics The estimated equation of housing expenditures in USA using 14 data is estimated as follow: HOUS: Housing expenditures ($), INC: Income ($). Standard errors are in parenthesis. HOUS = -740000000 + 41727767 In (INC) (53455198) (2790582) R2 = 0.96 The mean of housing expenditures is 180 (milllion $) and the mean of income is 420 million $. What is the elasticity of housing expenditures?arrow_forwardDoes drinking coffee affect blood flow, particularly during exercise? Doctors studying healthy subjects measured myocardial blood flow (MBF) during bicycle exercise before and after giving the subjects a dose of caffeine that was equivalent to drinking two cups of coffee. The following table shows the MBF levels before (baseline) and after (caffeine) the subjects took a tablet containing 200 mg of caffeinearrow_forward
- Below we list several variables. Which of these variables are quantitative, and which are qualitative? a The dollar amount on an accounts receivable invoice b The net profit for a company in 2017 c The stock exchange on which a company's stock is traded. d The nationl debt of the United States in 2017 e The advertising medium (radio, television, or print) used to promote a product.arrow_forwardTimber yield is approximately equal to the volume of a tree, however, this value is difficult to measure without first cutting the tree down. Instead, other variables, such as height and diameter, may be used to predict a tree's volume and yield. Below is data on diameter (inches), height (feet), and volume (cubic feet) diameter height volume 18 80 51.5 8.3 70 10.3 11.2 75 19.9 13.3 86 27.4 12.9 85 33.8 11.7 69 21.3 20.6 87 77 11.4 76 21.4 17.9 80 58.3 13.7 71 25.7 16 72 38.3 10.7 81 18.8 10.8 83 19.7 16.3 77 42.6 12 75 19.1 13.8 64 24.9 10.5 72 16.4 17.3 81 55.4 11 75 18.2 11.4 76 21 8.8 63 10.2 14.2 80 31.7 Develop a regression model to use diameter and height to predict volume. Report the adjusted R-squared. Blank 1. Fill in the blank, read surrounding text.arrow_forwardSeveral states have argued that the 65-mph speed limit has no justification and have refused to enforce it. The federal Department of Transportation (DOT) believes that the 65-mph limit saves lives. To illustrate its contention, the department regressed the number of traffic fatalities (Y) last year in a state on the state’s population (X1), the number of days of snow cover (X2), and the average speed of all cars (X3). The results are shown below. Table 10: Model Summary Model R R Square Adjusted R Square Std. Error of the Estimate 1 .821 a .780 .613 3.258 a. Predictors: (Constant), population, days of snow, average speed Table 11: Coefficients Coefficientsa Model Unstandardized Coefficients Standardized Coefficients t Sig. B Std. Error Beta 1 (Constant) 1.4 2.957 .473 .584 Population .00029 .00003 .0034 9.667 .000 Days of Snow 2.4 .62 .759 3.871 .000 Average Speed 10.3 1.1…arrow_forward
 Algebra & Trigonometry with Analytic GeometryAlgebraISBN:9781133382119Author:SwokowskiPublisher:Cengage