
Videos
Air pollution is a serious problem in many places. One form of air pollution that is suspected to cause respiratory illness is particulate matter (PM), which consists of tiny particles in the air. Particulate matter can come from many sources, most commonly ash from burning, but also from other sources such as tiny particles of rubber that wear off of automobile and truck tires.
The town of Libby. Montana, was recently the focus of a study on the effect of PM on the respiratory health of children. Many houses in Libby are heated by wood stoves, which produce a lot of particulate pollution. The level of PM is greatest in the winter when more stoves are being used, and declines as the weather becomes warmer. The study attempted to determine whether higher levels of PM affect the respiratory health of children. In one part of the study, schoolchildren were given a questionnaire to bring home to their parents. Among other things, the questionnaire asked whether the child had experienced symptoms of wheezing during the past 60 days. Most parents returned the questionnaire within a couple of weeks. Parents who did not respond promptly were sent another copy of the questionnaire through the mail. Many of these parents responded to this mailed version.
Table 1.2 presents, for each day, the number of questionnaires that were returned by parents of children who wheezed, the number returned by those who did not wheeze, the average concentration of particulate matter in the atmosphere during the past 60 days (in units of micrograms per cubic meter), and whether the questionnaires were delivered in school or through the mail.
We will consider a PM level of 17 or more to be high exposure, and a PM level of less than 17 to be low exposure.

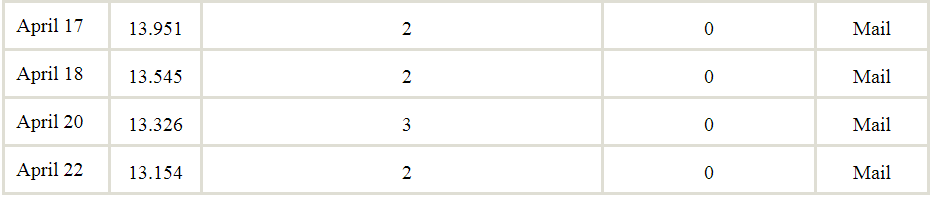
How many of the low-exposure people has wheeze symptoms?
Want to see the full answer?
Check out a sample textbook solution
Chapter 1 Solutions
Connect Hosted by ALEKS Online Access for Elementary Statistics


- What does the y -intercept on the graph of a logistic equation correspond to for a population modeled by that equation?arrow_forwardSection 9.1 Question #7 Rhino viruses typically cause common colds. In a test of the effectiveness of echinacea, 35 of the 42 subjects treated with echinacea developed rhinovirus infections. In a placebo group, 85 of the 99 subjects developed rhinovirus infections. Use a 0.05 significance level to test the claim that echinacea has an effect on rhinovirus infections. Complete parts (a) through (c) below. a. Test the claim using a hypothesis test. Consider the first sample to be the sample of subjects treated with echinacea and the second sample to be the sample of subjects treated with a placebo. What are the null and alternative hypotheses for the hypothesis test? A. H0: p1 = p2 H1: p1 > p2 B. H0: p1 ≠ p2 H1: p1 = p2 C. H0: p1 ≤ p2 H1: p1 ≠ p2 D. H0: p1 = p2 H1: p1 < p2 E. H0: p1 = p2 H1: p1 ≠ p2 F. H0: p1 ≥ p2 H1: p1 ≠ p2 Identify the test statistic. z= ____________ (Round to two decimal places as needed.) Identify the…arrow_forwardCell Phone Radiation Listed below are the measured radiation absorption rates (in W/kg) corresponding to these cell phones: iPhone 5S, BlackBerry Z30, Sanyo Vero, Optimus V, Droid Razr, Nokia N97, Samsung Vibrant, Sony Z750a, Kyocera Kona, LG G2, and Virgin Mobile Supreme. The data are from the Federal Communications Commission. If one of each model of cell phone is measured for radiation and the results are used to find the measures of variation, are the results typical of the population of cell phones that are in use?arrow_forward
- Cell Phone Radiation Listed below are the measured radiation absorption rates (in W/kg) corresponding to these cell phones: iPhone 5S, BlackBerry Z30, Sanyo Vero, Optimus V, Droid Razr, Nokia N97, Samsung Vibrant, Sony Z750a, Kyocera Kona, LG G2, and Virgin Mobile Supreme. The data are from the Federal Communications Commission (FCC). The media often report about the dangers of cell phone radiation as a cause of cancer. The FCC has a standard that a cell phone absorption rate must be 1.6 W/kg or less. If you are planning to purchase a cell phone, are any of the measures of center the most important statistic? Is there another statistic that is most relevant? If so, which one?arrow_forwardThe glycemic index (GI) is a rating system for foods containing carbohydrates. It shows how quickly each food affects your blood sugar (glucose) level when that food is eaten on its own. A random sample of 33 children were provided with a breakfast of low GI foods on one day and high GI foods on another. The two breakfasts contained the same quantities of carbohydrate, fat and protein. On each day a buffet lunch was provided, and the number of calories eaten at lunchtime were recorded. On the first day the children ate a low GI breakfast and on the second day a high GI breakfast. Let be the true mean of the differences in calorie intake for a high GI and a low GI breakfast, respectively. The researcher wants to conduct inference on to determine whether the kind of breakfast eaten has an effect on mean calorie intake. The differences are calculated as calorie intake after high-GI breakfast minus calorie intake after low-GI breakfast. The sample mean of the differences of 63.543…arrow_forwardThe glycemic index (GI) is a rating system for foods containing carbohydrates. It shows how quickly each food affects your blood sugar (glucose) level when that food is eaten on its own. A random sample of 33 children were provided with a breakfast of low GI foods on one day and high GI foods on another. The two breakfasts contained the same quantities of carbohydrate, fat and protein. On each day a buffet lunch was provided, and the number of calories eaten at lunchtime were recorded. On the first day the children ate a low GI breakfast and on the second day a high GI breakfast. Let be the true mean of the differences in calorie intake for a high GI and a low GI breakfast, respectively. The researcher wants to conduct inference on to determine whether the kind of breakfast eaten has an effect on mean calorie intake. The differences are calculated as calorie intake after high-GI breakfast minus calorie intake after low-GI breakfast. The sample mean of the differences of 63.543…arrow_forward
- Review Assignment #6 2021 - AP Statistics, section 4BI WebAssign webassign.net Rapio dentity Repidioantity 9. [-/1 Points] DETAILS YMSSTAT2 12.E.012. MY NOTES ASK YOUR TEACHER PRACTICE ANOTHER PTC is a substance that has a strong bitter taste for some people and is tasteless for others. The ability to taste PTC is inherited. About 67% of Italians can taste PTC, for example. You want to estimate the proportion of Americans with at least one Italian grandparent who can taste PTC. Starting with the 67% estimate for Italians, how large a sample must you test in order to estimate the proportion of PTC tasters within + 0.03 with 99% confidence? 10. [-/3 Points] DETAILS YMSSTAT212.E.014. ASK YOUR TEACHER PRACTICE ANOTHER MY NOTES An experiment on the side effects of pain relievers assigned arthritis patients to one of several over-the-counter pain medications. Of the 475 patients who took one brand of pain reliever, 24 suffered some "adverse symptom." Does the experiment provide strong…arrow_forward5.2arrow_forwardAn experiment is conducted to see the effect of light intensity on plant growth, what is the dependent variable in this scenario?arrow_forward
- Question Two It can be said that some professions/jobs come with more stress. This stress is sometimes carried over into family life, so much so that things can become unbearable at home. A researcher who is interested in such an issue decided to collect data on the level of rage/edginess towards family members. Perticipants were asked to rank the level of hostility they think they have been exerting towards family members due to their job. The resulting data is presented below. *11 is the highest level of hastility. Level of hostililty Number of professionala 0-1 4. 23 11 4-5 6-7 20 8-9 25 10-11 12 a. Calculate the following: iv. coefficient of variation v. Pearson's 1st measure of skewness b.Interpret the results af your calculations in part a. The end :)arrow_forwardQuestion Two It can be said that some professions/jobs come with more stress. This stress is sometimes carried over into family life, so much so that things can become unbearable at home. A researcher who is interested in such an issue decided to collect data on the level of rage/edginess towards family members. Perticipants were asked to rank the level of hostility they think they have been exerting towards family members due to their job. The resulting data is presented below. *11 is the highest level of hastility. Level of hostility Number of professionals 0-1 23 11 4-5 B. 6-7 20 8-9 25 10-11 12 a. Calculate the following: i. mean il. mode il, standard deviation iv. coefficient of variation v. Pearson's 1st measure of skewness b.interpret the results of your calculationa in part a. The end :)arrow_forwardOne doctor claims that a person's diastolic blood pressure can be lowered if, instead of taking medicine, the person listens to a relaxation tape every night. Ten subjects are selected at random. Your blood pressure, measured in millimeters of mercury, is listed below. All 10 patients are given the tapes and asked to listen to them every night for a month. At the end of the month, their blood pressure is taken again. The data is listed below. Use alpha equals 0.05 to test the doctor's claim.arrow_forward
 Linear Algebra: A Modern IntroductionAlgebraISBN:9781285463247Author:David PoolePublisher:Cengage Learning
 Glencoe Algebra 1, Student Edition, 9780079039897...AlgebraISBN:9780079039897Author:CarterPublisher:McGraw Hill
 Big Ideas Math A Bridge To Success Algebra 1: Stu...AlgebraISBN:9781680331141Author:HOUGHTON MIFFLIN HARCOURTPublisher:Houghton Mifflin Harcourt