
Connect Hosted by ALEKS Online Access for Elementary Statistics
3rd Edition
ISBN: 9781260373769
Author: William Navidi
Publisher: MCGRAW-HILL HIGHER EDUCATION
expand_more
expand_more
format_list_bulleted
Videos
Textbook Question
Chapter 1.3, Problem 20E
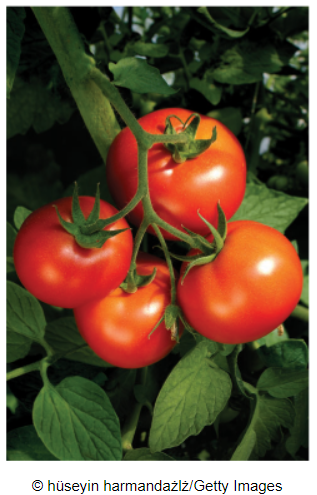
An agricultural scientist wants to determine the effect of fertilizer type on the yield of tomatoes. There are four types of fertilizer under consideration. She plants tomatoes on four plots of land. Each plot is treated identically except for receiving a different type of fertilizer.
- What are the treatments?
- Is this a randomized experiment or an observational study?
- The yields differ substantially among the four plots. Can you conclude that the differences in yield are due to the differences in fertilizer? Explain.
Expert Solution & Answer
Want to see the full answer?
Check out a sample textbook solution
Students have asked these similar questions
A study compared different psychological therapies for teenage girls suffering from anorexia. The study employed randomization in assigning girls to one of three therapies, only one of which is considered in this
example. Each girl's weight was measured before and after a period of therapy. The variable of interest was the weight change, defined as weight at the end of the study minus weight at the beginning of the study. The
weight change was positive if the girl gained weight and negative if she lost weight. For each of 17 girls who received the family therapy, the changes in weight were the following.
11 11 6 8
15
-4 -2 7
23
-7 -3 12 12 8
5
6
11
Find x, s, and se.
х 3
(Round to two decimal places as needed.)
(Round to two decimal places as needed.)
S =
(Round to three decimal places as needed.)
se=
The research and development (R&D) department of a paint manufacturer recently developed a new paint product. The developers are concerned the average area covered per gallon will be less for the new paint than for the existing product. To investigate this concern, the R&D department set up a test in which two random samples of paint were selected. The first sample consisted of 25 one-gallon containers of the company's existing product, and the second of 15 one-gallon containers of the new paint. The statistics shown were computed from eachsample and refer to the number of square feet that each gallon will cover. Based on the sample data, what should the developers conclude using a significance level of 0.05? Assume the populations are normally distributed with equal variances.Current Paint New Paint
Current Paint
New Paint
x1
=
Current Paint Column 423 sq. feet
x2
=
New Paint Column 418 sq feet
s1
=
21.7
s2
=…
You are a senior in the agricultural sciences department of NCSU doing an internship at a local dairy farm. Farmer Bill is an expert dairy farmer but has no background in quantitative decision
making. Bill claims that the milk produced by his grass-fed Jersey cattle has higher protein content than the milk made by his grain-fed Jersey cattle. His evidence? He says he can taste the
difference. You decide to put Bill's claim to the test. You randomly sample 21 grass-fed Jersey cattle and 18 grain-fed Jersey cattle, independently of one another, and obtain a sample of milk
from each cow. Both histograms appear approximately normal.
You test Ho : 4 = H2 VS. HA : H1 > 2. where 4 is the true mean protein content of milk produced by grass-fed Jersey cattle and-u, is that for the grain-fed cattle. Your test statistic is 1.98.
Based on this information, which of the following is true ?
Select one or more:
O a. The sample mean protein content for the milk samples from the grass-fed cattle you…
Chapter 1 Solutions
Connect Hosted by ALEKS Online Access for Elementary Statistics
Ch. 1.1 - In Exercises 7—12, fill in each blank with the...Ch. 1.1 - In Exercises 7—12, fill in each blank with the...Ch. 1.1 - In Exercises 7—12, fill in each blank with the...Ch. 1.1 - In Exercises 7—12, fill in each blank with the...Ch. 1.1 - In Exercises 7—12, fill in each blank with the...Ch. 1.1 - In Exercises 7—12, fill in each blank with the...Ch. 1.1 - In Exercises 13—16, determine whether the...Ch. 1.1 - In Exercises 13—16, determine whether the...Ch. 1.1 - In Exercises 13—16, determine whether the...Ch. 1.1 - In Exercises 13—16, determine whether the...
Ch. 1.1 - In Exercises 17—20, determine whether the number...Ch. 1.1 - In Exercises 17—20, determine whether the number...Ch. 1.1 - In Exercises 17—20, determine whether the number...Ch. 1.1 - In Exercises 17—20, determine whether the number...Ch. 1.1 - Exercises 21—24 refer to the population of...Ch. 1.1 - Exercises 21—24 refer to the population of...Ch. 1.1 - Exercises 21—24 refer to the population of...Ch. 1.1 - Exercises 21—24 refer to the population of...Ch. 1.1 - In Exercises 25—36, identify the kind of sample...Ch. 1.1 - In Exercises 25—36, identify the kind of sample...Ch. 1.1 - In Exercises 25—36, identify the kind of sample...Ch. 1.1 - In Exercises 25—36, identify the kind of sample...Ch. 1.1 - In Exercises 25—36, identify the kind of sample...Ch. 1.1 - In Exercises 25—36, identify the kind of sample...Ch. 1.1 - In Exercises 25—36, identify the kind of sample...Ch. 1.1 - In Exercises 25—36, identify the kind of sample...Ch. 1.1 - In Exercises 25—36, identify the kind of sample...Ch. 1.1 - In Exercises 25—36, identify the kind of sample...Ch. 1.1 - In Exercises 25—36, identify the kind of sample...Ch. 1.1 - In Exercises 25—36, identify the kind of sample...Ch. 1.1 - Computer network: Every third day, a computer...Ch. 1.1 - Smartphone apps: A smartphone app produces a...Ch. 1.1 - Youre giving me a headache: A pharmaceutical...Ch. 1.1 - Pay more for recreation? The director of the...Ch. 1.1 - Voter preferences: A pollster wants to sample 500...Ch. 1.1 - Quality control: Products come off an assembly...Ch. 1.1 - On-site day care: A large company wants to sample...Ch. 1.1 - The tax man cometh: The Internal Revenue Service...Ch. 1.1 - Draw a sample: Imagine that you are asked to...Ch. 1.1 - A systematic sample is a cluster sample: Explain...Ch. 1.2 - In Exercises 5—10, fill in each blank with the...Ch. 1.2 - In Exercises 5—10, fill in each blank with the...Ch. 1.2 - In Exercises 5—10, fill in each blank with the...Ch. 1.2 - In Exercises 5—10, fill in each blank with the...Ch. 1.2 - In Exercises 5—10, fill in each blank with the...Ch. 1.2 - In Exercises 5—10, fill in each blank with the...Ch. 1.2 - In Exercises 11—14, determine whether the...Ch. 1.2 - In Exercises 11—14, determine whether the...Ch. 1.2 - In Exercises 11—14, determine whether the...Ch. 1.2 - In Exercises 11—14, determine whether the...Ch. 1.2 - In Exercises 15—24, determine whether the data...Ch. 1.2 - In Exercises 15—24, determine whether the data...Ch. 1.2 - In Exercises 15—24, determine whether the data...Ch. 1.2 - In Exercises 15—24, determine whether the data...Ch. 1.2 - In Exercises 15—24, determine whether the data...Ch. 1.2 - In Exercises 15—24, determine whether the data...Ch. 1.2 - In Exercises 15—24, determine whether the data...Ch. 1.2 - In Exercises 15—24, determine whether the data...Ch. 1.2 - In Exercises 15—24, determine whether the data...Ch. 1.2 - In Exercises 15—24, determine whether the data...Ch. 1.2 - In Exercises 25—32, determine whether the data...Ch. 1.2 - In Exercises 25—32, determine whether the data...Ch. 1.2 - In Exercises 25—32, determine whether the data...Ch. 1.2 - In Exercises 25—32, determine whether the data...Ch. 1.2 - In Exercises 25—32, determine whether the data...Ch. 1.2 - In Exercises 25—32, determine whether the data...Ch. 1.2 - In Exercises 25—32, determine whether the data...Ch. 1.2 - In Exercises 25—32, determine whether the data...Ch. 1.2 - In Exercises 33—40, determine whether the data...Ch. 1.2 - In Exercises 33—40, determine whether the data...Ch. 1.2 - In Exercises 33—40, determine whether the data...Ch. 1.2 - In Exercises 33—40, determine whether the data...Ch. 1.2 - In Exercises 33—40, determine whether the data...Ch. 1.2 - In Exercises 33—40, determine whether the data...Ch. 1.2 - In Exercises 33—40, determine whether the data...Ch. 1.2 - In Exercises 33—40, determine whether the data...Ch. 1.2 - Music Videos: Following are the most-viewed videos...Ch. 1.2 - More Videos: The following table presents the...Ch. 1.2 - Hows the economy? A poll conducted by the American...Ch. 1.2 - Global warming: A recent Pew poll asked people...Ch. 1.2 - Graphic Novels: According to Time magazine, some...Ch. 1.2 - Watch sour language: According to Merriam Webster...Ch. 1.2 - Top ten video games: According to Wikipedia, the...Ch. 1.2 - At the movies: The following table provides...Ch. 1.2 - What do the numbers mean? A survey is administered...Ch. 1.3 - In Exercises 5—10, fill in each blank with the...Ch. 1.3 - In Exercises 5—10, fill in each blank with the...Ch. 1.3 - In Exercises 5—10, fill in each blank with the...Ch. 1.3 - In Exercises 5—10, fill in each blank with the...Ch. 1.3 - In Exercises 5—10, fill in each blank with the...Ch. 1.3 - In Exercises 5—10, fill in each blank with the...Ch. 1.3 - In Exercise 11—16, determine whether the...Ch. 1.3 - In Exercise 11—16, determine whether the...Ch. 1.3 - In Exercise 11—16, determine whether the...Ch. 1.3 - In Exercise 11—16, determine whether the...Ch. 1.3 - In Exercise 11—16, determine whether the...Ch. 1.3 - In Exercise 11—16, determine whether the...Ch. 1.3 - To determine the effectiveness of a new pain...Ch. 1.3 - A medical researcher wants to determine whether...Ch. 1.3 - A medical researcher wants to determine whether...Ch. 1.3 - An agricultural scientist wants to determine the...Ch. 1.3 - Air pollution and colds: A scientist wants to...Ch. 1.3 - Cold medications: A scientist wants to determine...Ch. 1.3 - Taxicabs and crime: A sociologist discovered that...Ch. 1.3 - Recovering from heart attacks: In a study of...Ch. 1.3 - Eat your vegetables: In an observational study,...Ch. 1.3 - Vocabulary and height: A vocabulary test was given...Ch. 1.3 - Secondhand smoke: A recent study compared the...Ch. 1.3 - Pollution in China: In a recent study, Z. Zhao and...Ch. 1.3 - The Salk Vaccine Trial: In 1954, the first vaccine...Ch. 1.3 - Another Salk Vaccine Trial: Another study of the...Ch. 1.3 - Smoking and health: A study was performed by the...Ch. 1.3 - Alcohol and liver disease: It is known that...Ch. 1.4 - In Exercises 3—5, fill in each blank with the...Ch. 1.4 - In Exercises 3—5, fill in each blank with the...Ch. 1.4 - In Exercises 3—5, fill in each blank with the...Ch. 1.4 - In Exercises 6—8, determine whether the...Ch. 1.4 - In Exercises 6—8, determine whether the...Ch. 1.4 - In Exercises 6—8, determine whether the...Ch. 1.4 - In Exercises 9—16, specify the type of bias...Ch. 1.4 - In Exercises 9—16, specify the type of bias...Ch. 1.4 - In Exercises 9—16, specify the type of bias...Ch. 1.4 - In Exercises 9—16, specify the type of bias...Ch. 1.4 - In Exercises 9—16, specify the type of bias...Ch. 1.4 - In Exercises 9—16, specify the type of bias...Ch. 1.4 - In Exercises 9—16, specify the type of bias...Ch. 1.4 - In Exercises 9—16, specify the type of bias...Ch. 1.4 - Nuclear power, anyone? In a survey conducted by...Ch. 1.4 - Whos calling, please? Random-digit dialing is a...Ch. 1.4 - Whos calling, please? Many polls are conducted...Ch. 1.4 - Order of choices: When multiple-choice questions...Ch. 1.4 - Literary Digest poll: In the 1936 presidential...Ch. 1 - Provide an example of a qualitative variable and...Ch. 1 - Is the name of your favorite author a qualitative...Ch. 1 - Prob. 3CQCh. 1 - Prob. 4CQCh. 1 - True or false: Ideally, a sample should represent...Ch. 1 - Prob. 6CQCh. 1 - Prob. 7CQCh. 1 - Prob. 8CQCh. 1 - Prob. 9CQCh. 1 - Prob. 10CQCh. 1 - Prob. 11CQCh. 1 - Prob. 12CQCh. 1 - In analyzing the course grades of students in an...Ch. 1 - Prob. 14CQCh. 1 - Prob. 15CQCh. 1 - Prob. 1RECh. 1 - Prob. 2RECh. 1 - Prob. 3RECh. 1 - Prob. 4RECh. 1 - In Exercises 5—8, identify the kind of sample...Ch. 1 - Prob. 6RECh. 1 - Prob. 7RECh. 1 - Prob. 8RECh. 1 - Fluoride and tooth decay: Researchers examine the...Ch. 1 - Better gas mileage: A taxi company in a large city...Ch. 1 - Prob. 11RECh. 1 - Prob. 12RECh. 1 - Prob. 13RECh. 1 - Prob. 14RECh. 1 - Prob. 15RECh. 1 - Describe the difference between a stratified...Ch. 1 - Prob. 2WAICh. 1 - Describe circumstances under which each of the...Ch. 1 - Suppose that you were asked to collect some...Ch. 1 - Prob. 5WAICh. 1 - What are the primary differences between a...Ch. 1 - What are the advantages of a double-blind study?...Ch. 1 - Prob. 8WAICh. 1 - Prob. 9WAICh. 1 - Air pollution is a serious problem in many places....Ch. 1 - Prob. 2CSCh. 1 - Air pollution is a serious problem in many places....Ch. 1 - Air pollution is a serious problem in many places....Ch. 1 - Air pollution is a serious problem in many places....Ch. 1 - Air pollution is a serious problem in many places....Ch. 1 - Is there a large difference between the percentage...Ch. 1 - Explain why the percentage of high-exposure people...Ch. 1 - Explain why the percentage of low-exposure people...Ch. 1 - As the weather sets warmer. PM goes down because...Ch. 1 - It is generally the case in epidemiologic studies...Ch. 1 - Rather than send out questionnaires, the...
Knowledge Booster


Learn more about
Need a deep-dive on the concept behind this application? Look no further. Learn more about this topic, statistics and related others by exploring similar questions and additional content below.Similar questions
- What is an experiment? Give two examples.arrow_forwardYou are a senior in the agricultural sciences department of NCSU doing an internship at a local dairy farm. Farmer Bill is an expert dairy farmer but has no background in quantitative decision making. Bill claims that the milk produced by his grass-fed Jersey cattle has higher protein content than the milk made by his grain-fed Jersey cattle. His evidence? He says he can taste the difference. You decide to put Bill's claim to the test. You randomly sample 21 grass-fed Jersey cattle and 18 grain- fed Jersey cattle, independently of one another, and obtain a sample of milk from each cow. Both histograms appear approximately normal. You test Ho : 41 = Hz VS. HA : 1 > Hz, where i is the true mean protein content of milk produced by grass-fed Jersey cattle and µz is that for the grain-fed cattle. Your test statistic is 1.98. Based on this information, which of the following is true ? Select one or more: O a. The sample mean protein content for the milk samples from the grass-fed cattle you…arrow_forwardDr. Mackintosh believes a new olfactory therapy would be more successful in promoting weight loss among obese patients. His patients are first weighed and then randomly assigned to olfactory therapy, dance therapy, or a control condition. At the end of the three weeks, the amount of weight lost is recorded. The results indicate no significant difference in the amount of weight lost between the three conditions. Identify the independent variable along with each level and the dependent variable.arrow_forward
- Lake Martin and Lake Fields are two large local lakes inhabited by white sturgeon. A while back there was an environmental disaster at Lake Martin. Melissa is an ecologist who wants to see if the mean weight (in kg) of adult white sturgeon now living in Lake Martin is less than the mean weight (in kg) of adult white sturgeon now living in Lake Fields. The ecologist catches a random sample of 11 adult white sturgeon at Lake Martin and a random sample of 12 adult white sturgeon at Lake Fields. (These samples are chosen independently.) Each fish has its weight (in kg) recorded. The white sturgeon caught at Lake Martin have a sample mean weight of 90.76 with a sample variance of 20.69. The white sturgeon caught at Lake Fields have a sample mean weight of 99.85 with a sample variance of 172.60. Assume that the two populations of weights are approximately normally distributed. Can the ecologist conclude, at the 0.10 level of significance, that the population mean of the weights of adult…arrow_forwardA medical geographer in Kenya is studying the distribution of an infectious strain of "sleeping sickness". She believes it should be more prevalent among human populations that live in river floodplains. Data were collected on the number of infections from a random sample of 100 people on a floodplain and a second sample of 125 people living in an adjacent highlands area. 10 people from the floodplain and 8 people from the highlands were found to be infected. The proportion of people on a flood plain that were infected is P1. The proportion of people from the highlands is that were infected is P2. What is the null hypothesis? OP1 *P2 P1 > P2 P1 P2 P1 s P2 P1 = P2arrow_forwardYou are a public health researcher. You want to see if the average age that a person starts smoking has changed over time. Smokers are recruited to answer a survey that asked at what age they started smoking. You divided participants into two groups, one is participants under the age of 30 and the second for participants over the age of 30. The average age for the two groups were compared. Which statistical test would be best to determine if there is a significant different in starting age between the two groups.arrow_forward
- You are a public health researcher. You want to see if the average age that a person starts smoking has changed over time. Smokers are recruited to answer a survey that asked at what age they started smoking. You divided participants into two groups, one is participants under the age of 30 and the second for participants over the age of 30. The average age for the two groups were compared. Which statistical test would be best to determine if there is a significant different in starting age between the two groups. one-sample t-test related samples t-test independent samples t-test ANOVAarrow_forwardStatus regarding lab techniques course Took the techniques course Didn't take the techniques course Total Involved in no incident 40 58 98 Laboratory performance Involved in exactly one incident 17 22.57 1.375 44 38.43 0.807 61 Involved in 2+ incidents 17 0 24 0 41 Total 74 126 200arrow_forward(OPHTHALMOLOGY) The following data are from a study on Botox injections. Patients received a high-dose injection in one eye (experimental treatment = treatment E) and a low-dose injection in the other eye (control treatment = treatment C). Patients were asked to rate the level of pain in each eye on a 1–10 scale, with higher scores indicating more pain. The assignment of treatments to eyes was randomized. The subjects came back over several visits. Data from the last visit are given in the following table: 1. Which of the following is the correct test to conduct given the situation above? 2. The hypotheses are: 3. What is the level of significance? 4. What is the computed test statistic? Hint: Use (mean of "Pain in E eye") minus (mean of "Pain in C eye") 5. What is the correct decision based on the p-value or critical value method?arrow_forward
- Mandrake Falls High School is experimenting with a weekend course in laboratory techniques. Of the 200 students enrolled in lab classes at Mandrake, only 78 have been able to take the techniques course. Mandrake is interested in evaluating the course's effectiveness in propagating safety in the laboratories. During regular lab classes, lab instructors have recorded harmful lab incidents: accidents, misuse of lab equipment, etc. The school is looking at the data and examining two variables: laboratory performance ("involved in no incident", "involved in exactly one incident", or "involved in 2+ incidents") and status regarding lab techniques course ("took the techniques course" or "didn't take the techniques course"). The contingency table below gives a summary of the data that have been gathered so far. In each of the 6 cells of the table are three numbers: the first number is the observed cell frequency (f); the second number is the expected cell frequency (E) under the assumption…arrow_forwardA clinical psychologist is interested in the effect of a new treatment for treating depression. She randomly divides her clients into two groups. One group receives the new treatment and the other group receives the old treatment (control group). At the end of treatment, she assesses the severity of their depression on a scale ranging from 0 to 20 (higher scores indicate greater depression). Was there a significant difference in depression scores between the two treatments? New Treatment Old Treatment 2 7 5 10 3 6 8 8 11 4 4 8 6 10 4 4arrow_forwardYou're trying to find out how many students who graduate with accounting degrees from large universities are employed at graduation. You design an experiment where you collect information on several variables from recent graduates from the University of Florida accounting program. Specifically, you survey 198 alumni about their employment status, age at graduation, gender, and grade point average. What's the population, and what's the sample? The population is everyone at the University of Florida, and the sample is the 198 alumni who returned the survey. The population is the 198 alumni who returned the survey, and the sample is accounting alumni from large universities. The population is college students at large universities, and the sample is accounting students. The population is accounting program alumni at large universities, and the sample is the 198 alumni who returned the survey. Researchers are interested in increasing female participation in the technology…arrow_forward
arrow_back_ios
SEE MORE QUESTIONS
arrow_forward_ios
Recommended textbooks for you
 Big Ideas Math A Bridge To Success Algebra 1: Stu...AlgebraISBN:9781680331141Author:HOUGHTON MIFFLIN HARCOURTPublisher:Houghton Mifflin Harcourt
 Holt Mcdougal Larson Pre-algebra: Student Edition...AlgebraISBN:9780547587776Author:HOLT MCDOUGALPublisher:HOLT MCDOUGAL
 Glencoe Algebra 1, Student Edition, 9780079039897...AlgebraISBN:9780079039897Author:CarterPublisher:McGraw Hill
 College Algebra (MindTap Course List)AlgebraISBN:9781305652231Author:R. David Gustafson, Jeff HughesPublisher:Cengage Learning
Big Ideas Math A Bridge To Success Algebra 1: Stu...
Algebra
ISBN:9781680331141
Author:HOUGHTON MIFFLIN HARCOURT
Publisher:Houghton Mifflin Harcourt
Holt Mcdougal Larson Pre-algebra: Student Edition...
Algebra
ISBN:9780547587776
Author:HOLT MCDOUGAL
Publisher:HOLT MCDOUGAL
Glencoe Algebra 1, Student Edition, 9780079039897...
Algebra
ISBN:9780079039897
Author:Carter
Publisher:McGraw Hill
College Algebra (MindTap Course List)
Algebra
ISBN:9781305652231
Author:R. David Gustafson, Jeff Hughes
Publisher:Cengage Learning
Introduction to experimental design and analysis of variance (ANOVA); Author: Dr. Bharatendra Rai;https://www.youtube.com/watch?v=vSFo1MwLoxU;License: Standard YouTube License, CC-BY