
Videos
Air pollution is a serious problem in many places. One form of air pollution that is suspected to cause respiratory illness is particulate matter (PM), which consists of tiny particles in the air. Particulate matter can come from many sources, most commonly ash from burning, but also from other sources such as tiny particles of rubber that wear off of automobile and truck tires.
The town of Libby. Montana, was recently the focus of a study on the effect of PM on the respiratory health of children. Many houses in Libby are heated by wood stoves, which produce a lot of particulate pollution. The level of PM is greatest in the winter when more stoves are being used, and declines as the weather becomes warmer. The study attempted to determine whether higher levels of PM affect the respiratory health of children. In one part of the study, schoolchildren were given a questionnaire to bring home to their parents. Among other things, the questionnaire asked whether the child had experienced symptoms of wheezing during the past 60 days. Most parents returned the questionnaire within a couple of weeks. Parents who did not respond promptly were sent another copy of the questionnaire through the mail. Many of these parents responded to this mailed version.
Table 1.2 presents, for each day, the number of questionnaires that were returned by parents of children who wheezed, the number returned by those who did not wheeze, the average concentration of particulate matter in the atmosphere during the past 60 days (in units of micrograms per cubic meter), and whether the questionnaires were delivered in school or through the mail.
We will consider a PM level of 17 or more to be high exposure, and a PM level of less than 17 to be low exposure.
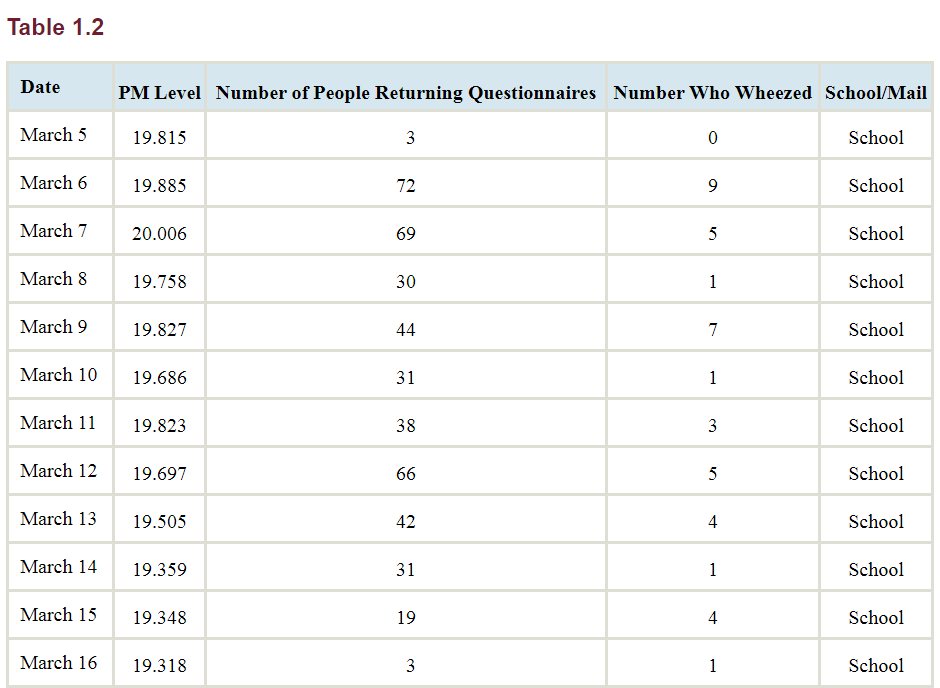
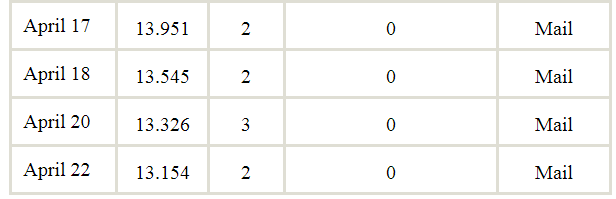
What percentage of the low-exposure people had wheeze symptoms?
Want to see the full answer?
Check out a sample textbook solution
Chapter 1 Solutions
Connect Hosted by ALEKS Online Access for Elementary Statistics


- What does the y -intercept on the graph of a logistic equation correspond to for a population modeled by that equation?arrow_forwardThe authors of a paper compared two different instruments for measuring a person's capacity for breathing out air. (This measurement is helpful in diagnosing various lung disorders.) The two instruments considered were a Wright peak flow meter and a mini-Wright peak flow meter. Seventeen people participated in the study, and for each person air flow was measured once using the Wright meter and once using the mini-Wright meter. The Wright meter is thought to provide a better measure of air flow, but the mini-Wright meter is easier to transport and to use. Use of the mini-Wright meter could be recommended as long as there is not convincing evidence that the mean reading for the mini-Wright meter is different from the mean reading for Wright meter. For purposes of this exercise, you can assume that it is reasonable to consider the 17 people who participated in this study as representative of the population of interest. Data values from this paper are given in the accompanying table.…arrow_forwardAccording to a report by the U.S. Environmental Protection Agency (EPA), containers and packaging generated about 34.6% of all municipal solid waste (MSW) in the country in a recent year. This was the largest category of such waste. The next highest group was nondurable goods, which accounted for 25.4 % of waste. This was followed by durable goods at 10.9%, yard trimmings/other at 13.4%, and food scraps at 15.7%. Suppose last year, one large midwestern U.S. city processed 303 (1,000 tons) of MSW broken down by waste type as follows: Waste Type Containers and Packaging Nondurable Goods Durable Goods Yard Trimmings/Other Food Scraps MSW (1,000 tons) 129 73 28 45 28 Determine if there is a significant difference between the distribution of municipal solid waste in this midwestern city and the distribution released by the EPA a. Specify the hypotheses. Ho HA b. Calculate the test statistic and p-value. Round intermediate calculations to AT LEAST 4 decimal places and final answers to 3…arrow_forward
- The table below shows the number of deaths in the U.S. in a year due to a variety of causes. For these questions, assume these values are not changing from year to year, and that the population of the United States is 312 million people. Cause Deaths Passenger car occupant 13,100 Motorcycle driver 4,500 Tornado 553 Skydiving 56 h) People sometimes claim motorcycle riding is less dangerous than driving. Does the data support this claim? What additional information and/or calculations would be useful to evaluate this claim?arrow_forwardSection 9.1 Question #7 Rhino viruses typically cause common colds. In a test of the effectiveness of echinacea, 35 of the 42 subjects treated with echinacea developed rhinovirus infections. In a placebo group, 85 of the 99 subjects developed rhinovirus infections. Use a 0.05 significance level to test the claim that echinacea has an effect on rhinovirus infections. Complete parts (a) through (c) below. a. Test the claim using a hypothesis test. Consider the first sample to be the sample of subjects treated with echinacea and the second sample to be the sample of subjects treated with a placebo. What are the null and alternative hypotheses for the hypothesis test? A. H0: p1 = p2 H1: p1 > p2 B. H0: p1 ≠ p2 H1: p1 = p2 C. H0: p1 ≤ p2 H1: p1 ≠ p2 D. H0: p1 = p2 H1: p1 < p2 E. H0: p1 = p2 H1: p1 ≠ p2 F. H0: p1 ≥ p2 H1: p1 ≠ p2 Identify the test statistic. z= ____________ (Round to two decimal places as needed.) Identify the…arrow_forwardSource: Centers for Disease Control and Prevention. [Vital Signs: binge Drinking among women and high school girls - United States 2011]. MMWR 2013;62:pg 9-13. http://www.cdc.gov/mmwr/pdf/wk/mm6201.pdf The article referenced says that when women aged 25-34 binge drink they have on average 7.2 drinks. I'm wondering if women in Laramie are different than the national average. Assume the standard deviation is 0.42 drinks. I sample 9 women who have done binge drinking, and their average is 5.1 drinks. Can I say at the 0.05 significance level that the average is not equal to 7.2? Hg:X = 7.2 HA:X + 7.2 Ho:x + 7.2 HAix = 7.2 Ho:u - 5.1 Ho: = 7.2 Họ:* 5.1 Ho:u + 7.2 HA 5.1 HA:H 7.2 HA:H - 5.1 HA:H - 7.2 P-value ODo not answer until you choose an a ODo not answer until you choose an a You cannot answer this until you choose an a O You cannot answer this until you choose an aarrow_forward
- When exposed to an infection, a person typically develops antibodies. The extent to which theantibodies respond can be measured by looking at a persons titer, which is a measure of the number of antibodies present. The higher the titer is, the more antibodies that are present. The data in Table represent the titers of 11 ill people and 11 healthy people exposed to the tularemia virus in Vermont. Is the level of titer in the ill group greater than the level of titer in the healthy group? Use the α = 0.10 level of significance.arrow_forwardCell Phone Radiation Listed below are the measured radiation absorption rates (in W/kg) corresponding to these cell phones: iPhone 5S, BlackBerry Z30, Sanyo Vero, Optimus V, Droid Razr, Nokia N97, Samsung Vibrant, Sony Z750a, Kyocera Kona, LG G2, and Virgin Mobile Supreme. The data are from the Federal Communications Commission. If one of each model of cell phone is measured for radiation and the results are used to find the measures of variation, are the results typical of the population of cell phones that are in use?arrow_forwardChapter 4, Section 3, Exercise 104 Mercury Levels in FishFigure 1 shows a scatterplot of the acidity (pH) for a sample of n=53 Florida lakes vs the average mercury level (ppm) found in fish taken from each lake. There appears to be a negative trend in the scatterplot, and we wish to test whether there is significant evidence of a negative association between pH and mercury levels. Figure 1: Water pH vs mercury levels of fish in Florida lakes Your answer is partially correct. Try again. (a) What are the null and alternative hypotheses?arrow_forward
- A certain virus affects 0.4% of the population. A test used to detect the virus in a person is positive 90% of the time if the person has the virus (true positive) and 10% of the time if the person does not have the virus (false positive). Fill out the remainder of the following table and use it to answer the two questions below based on a total sample of 100,000 people. Virus No Virus Total Positive Test Negative Test Total 100,000 a) Find the probability that a person has the virus given that they have tested positive. Round your answer to the nearest hundredth of a percent and do not include a percent sign. % b) Find the probability that a person does not have the virus given that they test negative. Round your answer to the nearest hundredth of a percent and do not include a percent sign. %arrow_forwardonly part 1, 3, 4 please In the article “Explaining an Unusual Allergy,” appearing on the Everyday Health Network, Dr. A. Feldweg explained that allergy to sulfites is usually seen in patients with asthma. The typical reaction is a sudden increase in asthma symptoms after eating a food containing sulfites. Studies are performed to estimate the percentage of the nation’s 10 million asthmatics who are allergic to sulfites. In one survey, 38 of 500 randomly selected U.S. asthmatics were found to be allergic to sulfites. 95% confidence. Determine the margin of error for the estimate of p. Obtain a sample size that will ensure a margin of error of at most 0.01 for a 95% confidence interval without making a guess for the observed value of ?̂ . Find a 95% confidence interval for p if, for a sample of the size determined in part (b), the proportion of asthmatics sampled who are allergic to sulfites in 0.071. Determine the margin of error for the estimate in part (c) and compare it to…arrow_forwardThe glycemic index (GI) is a rating system for foods containing carbohydrates. It shows how quickly each food affects your blood sugar (glucose) level when that food is eaten on its own. A random sample of 33 children were provided with a breakfast of low GI foods on one day and high GI foods on another. The two breakfasts contained the same quantities of carbohydrate, fat and protein. On each day a buffet lunch was provided, and the number of calories eaten at lunchtime were recorded. On the first day the children ate a low GI breakfast and on the second day a high GI breakfast. Let be the true mean of the differences in calorie intake for a high GI and a low GI breakfast, respectively. The researcher wants to conduct inference on to determine whether the kind of breakfast eaten has an effect on mean calorie intake. The differences are calculated as calorie intake after high-GI breakfast minus calorie intake after low-GI breakfast. The sample mean of the differences of 63.543…arrow_forward
 Linear Algebra: A Modern IntroductionAlgebraISBN:9781285463247Author:David PoolePublisher:Cengage Learning
 Glencoe Algebra 1, Student Edition, 9780079039897...AlgebraISBN:9780079039897Author:CarterPublisher:McGraw Hill
 Big Ideas Math A Bridge To Success Algebra 1: Stu...AlgebraISBN:9781680331141Author:HOUGHTON MIFFLIN HARCOURTPublisher:Houghton Mifflin Harcourt