
The graph thatrepresents the FRED data on gross federal debt held by the public as a percent of
Explanation of Solution
The dept to GDP ratio is the comparison of public debt of a country to its gross domestic product. This ratio indicates the ability to pay back debts of a particular country.
The following table represents the FRED data on gross federal debt held by the public as a percent of GDP for the United States:
| Date | Gross federal debt as % of GDP |
| 1945-01-01 | 103.15473 |
| 1946-01-01 | 106.31331 |
| 1947-01-01 | 89.85802 |
| 1948-01-01 | 78.80700 |
| 1949-01-01 | 78.64942 |
| 1950-01-01 | 73.04212 |
| 1951-01-01 | 61.77323 |
| 1952-01-01 | 58.47428 |
| 1953-01-01 | 56.11251 |
| 1954-01-01 | 57.48318 |
| 1955-01-01 | 53.25775 |
| 1956-01-01 | 49.44887 |
| 1957-01-01 | 46.26202 |
| 1958-01-01 | 47.02543 |
| 1959-01-01 | 44.99151 |
| 1960-01-01 | 43.65927 |
| 1961-01-01 | 42.40408 |
| 1962-01-01 | 41.06497 |
| 1963-01-01 | 39.84620 |
| 1964-01-01 | 37.51863 |
| 1965-01-01 | 35.13456 |
| 1966-01-01 | 32.41892 |
| 1967-01-01 | 31.00151 |
| 1968-01-01 | 30.77656 |
| 1969-01-01 | 27.32861 |
| 1970-01-01 | 26.38584 |
| 1971-01-01 | 26.01193 |
| 1972-01-01 | 25.20503 |
| 1973-01-01 | 23.91650 |
| 1974-01-01 | 22.24246 |
| 1975-01-01 | 23.42567 |
| 1976-01-01 | 25.48292 |
| 1977-01-01 | 26.37588 |
| 1978-01-01 | 25.81648 |
| 1979-01-01 | 24.37071 |
| 1980-01-01 | 24.91507 |
| 1981-01-01 | 24.61458 |
| 1982-01-01 | 27.65127 |
| 1983-01-01 | 31.29577 |
| 1984-01-01 | 32.37061 |
| 1985-01-01 | 34.73859 |
| 1986-01-01 | 38.00743 |
| 1987-01-01 | 38.92310 |
| 1988-01-01 | 39.17930 |
| 1989-01-01 | 38.83132 |
| 1990-01-01 | 40.44175 |
| 1991-01-01 | 43.66586 |
| 1992-01-01 | 46.00536 |
| 1993-01-01 | 47.36272 |
| 1994-01-01 | 47.11114 |
| 1995-01-01 | 47.17956 |
| 1996-01-01 | 46.25348 |
| 1997-01-01 | 43.97875 |
| 1998-01-01 | 41.05898 |
| 1999-01-01 | 37.71703 |
| 2000-01-01 | 33.25873 |
| 2001-01-01 | 31.37078 |
| 2002-01-01 | 32.37257 |
| 2003-01-01 | 34.15357 |
| 2004-01-01 | 35.16944 |
| 2005-01-01 | 35.22534 |
| 2006-01-01 | 34.95575 |
| 2007-01-01 | 34.84050 |
| 2008-01-01 | 39.44241 |
| 2009-01-01 | 52.21632 |
| 2010-01-01 | 60.15788 |
| 2011-01-01 | 65.16421 |
| 2012-01-01 | 69.64929 |
| 2013-01-01 | 71.38997 |
| 2014-01-01 | 72.91443 |
| 2015-01-01 | 71.97179 |
| 2016-01-01 | 75.70168 |
| 2017-01-01 | 75.13234 |
| 2018-01-01 | 76.52784 |
The following graph represents the FRED data on gross federal debt held by the public as a percent of GDP for the United States:
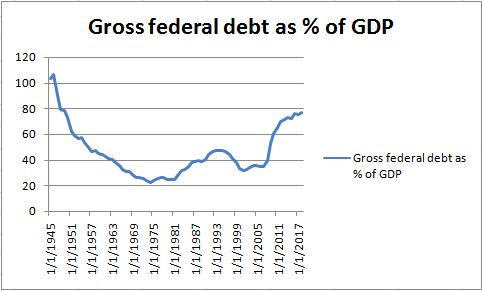
The post-1945 period is considered to be the post-war era. Just after the Second World War in 1946 (the debt ratio was a high of 10,31331), the United States experienced sustained declines in the federal debt-to-GDP ratio. The decrease in the federal debt-to-GDP ratio lasts until 1974 (22.24246 debt-to-GDP ratio).
The most critical period of debt growth is the 1980 to 1995. The next biggest increase was from 1974 to 1979. The debt has exploded surprisingly since 2008 (the Great Recession), the period from 2008 to the end of 2013 continues to rise in the federal debt-to-GDP ratio of United States.
The causes of sharp debt-to-GDP ratio expansion are the rising income inequality of the country and its persistent deficit.
President N's decision to dissociate the dollar from the gold standard in 1971 was the first reason behind persistent deficit because dollars were no longer exchanged for gold and the government was free to spend as long as it could, worsening the deficits.
High income disparities and large deficits result in spending inequalities, so rise in the amount of U.S. debt persists as a weapon that can keep the economy from slowing down and increase
Want to see more full solutions like this?

- Why do you suppose that U.S. GDP is so much higher today than 50 or 100 years ago?arrow_forwardLast year, a small nation with abundant forests cut down 200 worth of trees. It then turned 100 worth of trees into 150 worth of lumber. It used 100 worth of that lumber to produce $250 worth of bookshelves. Assuming the country produces no other outputs, and there are no other inputs used in producing trees, lumber, and bookshelves, what is this nations GDP? In other words, what is the value of the final goods the nation produced including trees, lumber and bookshelves?arrow_forwardExplain briefly whether each of the following would cause GDP to overstate or understate the degree of change in the broad standard of living. The environment becomes dirtier The crime rate declines A greater variety of goods become available to consumers Infant mortality declinesarrow_forward
 Survey of Economics (MindTap Course List)EconomicsISBN:9781305260948Author:Irvin B. TuckerPublisher:Cengage Learning
 Economics: Private and Public Choice (MindTap Cou...EconomicsISBN:9781305506725Author:James D. Gwartney, Richard L. Stroup, Russell S. Sobel, David A. MacphersonPublisher:Cengage Learning
 Macroeconomics: Private and Public Choice (MindTa...EconomicsISBN:9781305506756Author:James D. Gwartney, Richard L. Stroup, Russell S. Sobel, David A. MacphersonPublisher:Cengage Learning
