
Videos
Interpreting regression results, matching time periods. Nandita Summers works at Modus, a store that caters to fashion for young adults. Nandita is responsible for the store’s online advertising and promotion budget. For the past year, she has studied search engine optimization and has been purchasing keywords and display advertising on Google, Facebook, and Twitter. In order to analyze the effectiveness of her efforts and to decide whether to continue online advertising or move her advertising dollars back to traditional print media, Nandita collects the following data:
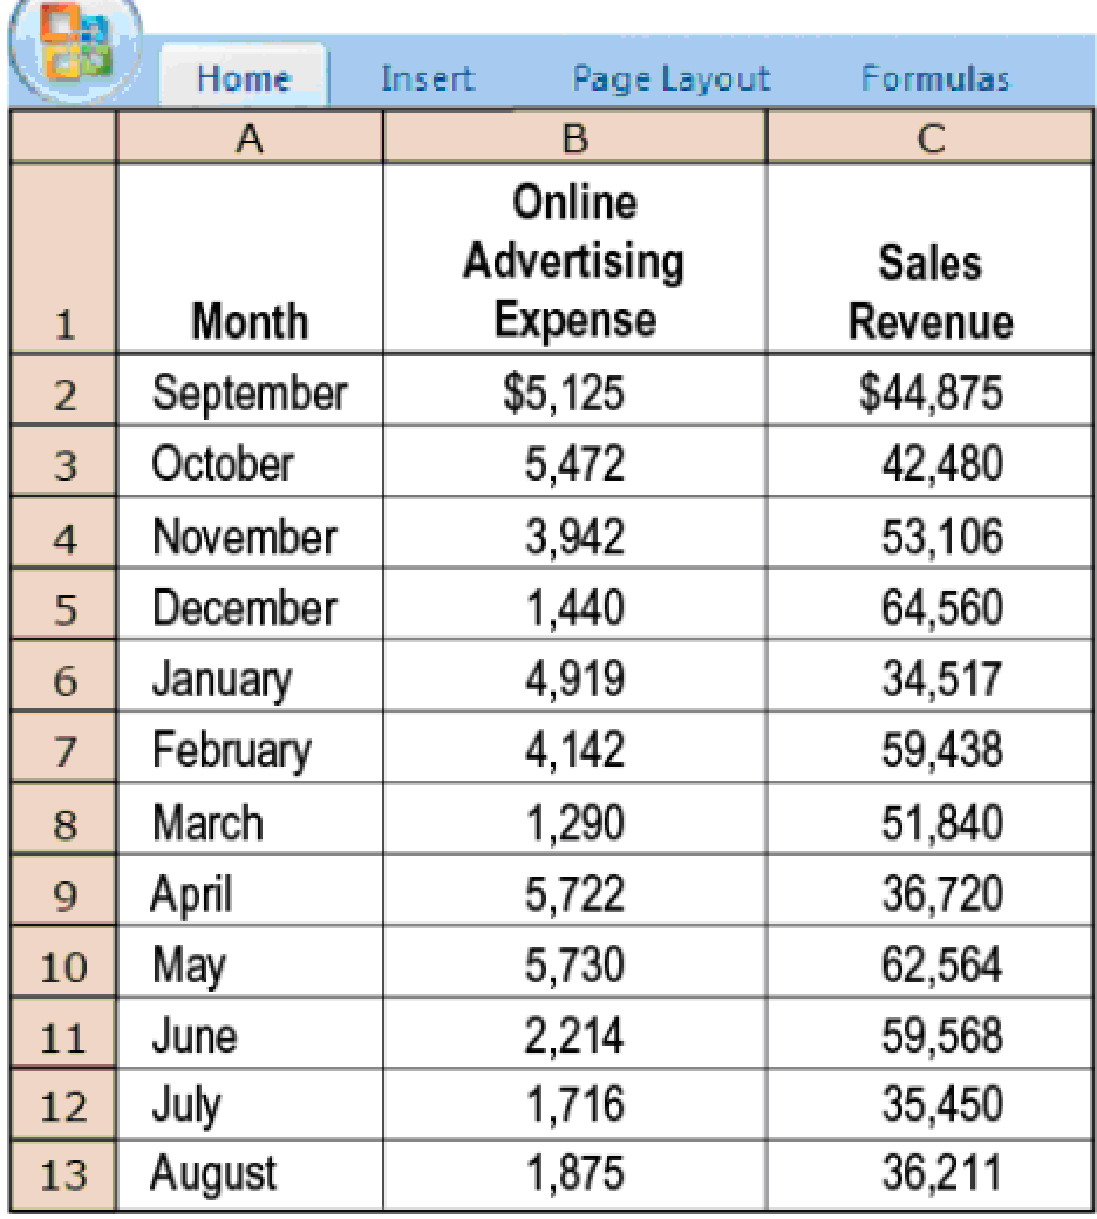
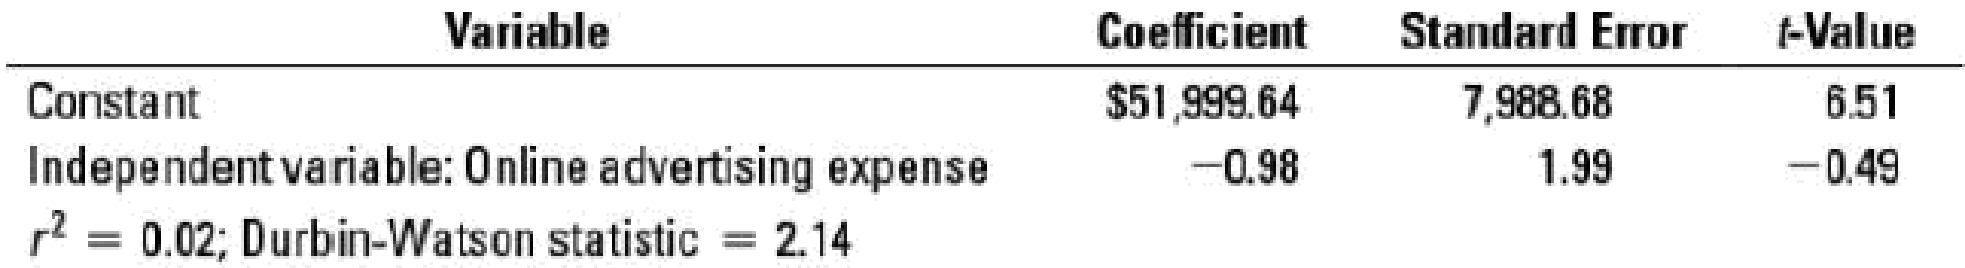
- 1. Nandita performs a regression analysis, comparing each month’s online advertising expense with that month’s revenue. Verify that she obtains the following result:
Required
- 2. Plot the preceding data on a graph and draw the regression line. What does the cost formula indicate about the relationship between monthly online advertising expense and monthly revenues? Is the relationship economically plausible?
- 3. After further thought, Nandita realizes there may have been a flaw in her approach. In particular, there may be a lag between the time customers click through to the Modus website and peruse its social media content (which is when the online ad expense is incurred) and the time they actually shop in the physical store. Nandita modifies her analysis by comparing each month’s sales revenue to the advertising expense in the prior month. After discarding September revenue and August advertising expense, show that the modified regression yields the following:
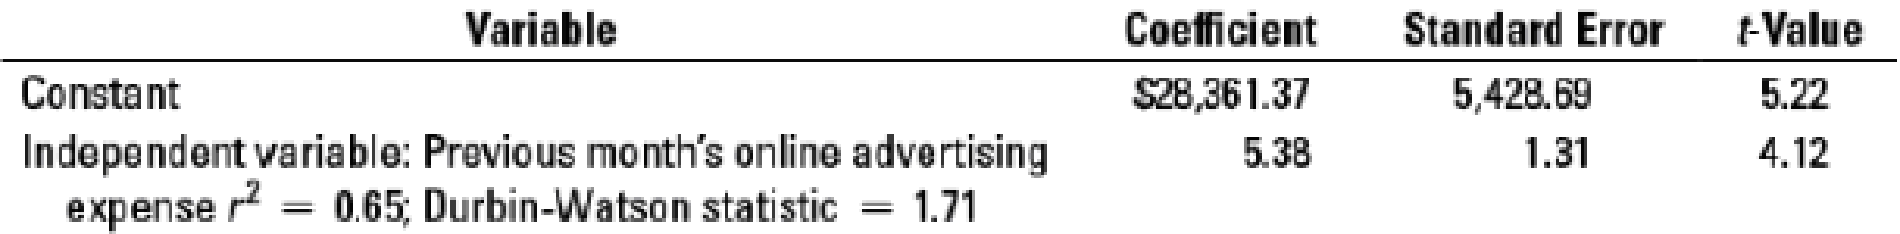
- 4. What does the revised formula indicate? Plot the revised data on a graph. Is this relationship economically plausible?
- 5. Can Nandita conclude that there is a cause-and-effect relationship between online advertising expense and sales revenue? Why or why not?
Want to see the full answer?
Check out a sample textbook solution
Chapter 10 Solutions
HORNGRENS COST ACCOUNTING W/ACCESS


- The Lockit Company manufactures door knobs for residential homes and apartments. Lockit is considering the use of simple (single-driver) and multiple regression analyses to forecast annual sales because previous forecasts have been inaccurate. The new sales forecast will be used to initiate the budgeting process and to identify more completely the underlying process that generates sales. Larry Husky, the controller of Lockit, has considered many possible independent variables and equations to predict sales and has narrowed his choices to four equations. Husky used annual observations from 20 prior years to estimate each of the four equations. Following are definitions of the variables used in the four equations and a statistical summary of these equations: St=ForecastedsalesindollarsforLockitinperiodtSt1=ActualsalesindollarsforLockitinperiodt1Gt=ForecastedU.S.grossdomesticproductinperiodtGt1=ActualU.S.grossdomesticproductinperiodt1Nt1=Lockitsnetincomeinperiodt1 Required: 1. Write Equations 2 and 4 in the form Y = a + bx. 2. If actual sales are 1,500,000 in the current year, what would be the forecasted sales for Lockit in the coming year? 3. Explain why Larry Husky might prefer Equation 3 to Equation 2. 4. Explain the advantages and disadvantages of using Equation 4 to forecast sales.arrow_forwardThe Northwest regional manager of Logan Outdoor Equipment Company has conducted a study to determine how her store managers are allocating their time. A study was undertaken over three weeks that collected the following data related to the percentage of time each store manager spent on the tasks of attending required meetings, preparing business reports, customer interaction, and being idle. The results of the data collection appear in the following table: a. Create a stacked-bar chart with locations along the vertical axis. Reformat the bar chart to best display these data by adding axis labels, a chart title, and so on. b. Create a clustered-bar chart with locations along the vertical axis and clusters of tasks. Reformat the bar chart to best display these data by adding axis labels, a chart title, and the like. c. Create multiple bar charts in which each location becomes a single bar chart showing the percentage of time spent on tasks. Reformat the bar charts to best display these data by adding axis labels, a chart title, and so forth. d. Which form of bar chart (stacked, clustered, or multiple) is preferable for these data? Why? e. What can we infer about the differences among how store managers are allocating their time at the different locations?arrow_forwardThe controller for Dohini Manufacturing Company felt that the number of purchase orders alone did not explain the monthly purchasing cost. He knew that nonstandard orders (for example, one requiring an overseas supplier) took more time and effort. He collected data on the number of nonstandard orders for the past 12 months and added that information to the data on purchasing cost and total number of purchase orders. Multiple regression was run on the above data; the coefficients shown by the regression program are: Required: 1. Construct the cost formula for the purchasing activity showing the fixed cost and the variable rate. 2. If Dohini Manufacturing Company estimates that next month will have 430 total purchase orders and 45 nonstandard orders, what is the total estimated purchasing cost for that month? (Round your answer to the nearest dollar.) 3. What if Dohini Manufacturing wants to estimate purchasing cost for the coming year and expects 5,340 purchase orders and 580 nonstandard orders? What will estimated total purchasing cost be? What is the total fixed purchasing cost? Why doesnt it equal the fixed cost calculated in Requirement 2? (Round your answers to the nearest dollar.)arrow_forward
- RunningWithTheDevil.com created a web site to market running shoes and other running apparel. Management would like a special pop-up offer to appear for female web-site visitors and a different special pop-up offer to appear for male web-site visitors. From a sample of past web-site visitors, RunningWithTheDevil’s management learns that 60% of the visitors are male and 40% are female. What is the probability that a current visitor to the web site is female? Suppose that 30% of RunningWithTheDevil’s female visitors previously visited LetsRun.com and 10% of male customers previously visited LetsRun.com. If the current visitor to RunningWithTheDevil’s web site previously visited LetsRun.com, what is the revised probability that the current visitor is female? Should the RunningWithTheDevil’s web site display the special offer that appeals to female visitors or the special offer that appeals to male visitors?arrow_forwardA sociologist was hired by a large city hospital to investigate the relationship between the number of unauthorized days that employees are absent per year and the distance (miles) between home and work for the employees. A sample of 10 employees was chosen, and the following data were collected. a. Develop a scatter chart for these data. Does a linear relationship appear reasonable? Explain. b. Use the data to develop an estimated regression equation that could be used to predict the number of days absent given the distance to work. What is the estimated regression model? c. What is the 99% confidence interval for the regression parameter 1? Based on this interval, what conclusion can you make about the hypotheses that the regression parameter 1 is equal to zero? d. What is the 99% confidence interval for the regression parameter 0? Based on this interval, what conclusion can you make about the hypotheses that the regression parameter 0 is equal to zero? e. How much of the variation in the sample values of number of days absent does the model you estimated in part (b) explain?arrow_forwardRizzo Goal Inc. produces and sells hockey equipment, often custom made for online orders. The company has the following performance metrics on its balanced scorecard: days from ordered to delivered, number of shipping errors, customer retention rate, and market share. A measure map illustrates that the days from ordered to delivered and the number of shipping errors are both expected to directly affect the customer retention rate, which affects market share. Additional internal analysis finds that: Every shipping error over three shipping errors per month reduces the customer retention rate by 1.5%. On average, each day above three days from ordered to delivered yields a reduction in the customer retention rate of 1%. Each day before three days from order to delivery yields an increase in the customer retention rate of 1%, on average. Rizzo Goal Inc.s current customer retention rate is 60%. The company estimates that for every 1% increase or decrease in the customer retention rate, market share changes 0.5% in the same direction. Rizzo Goal Inc.s current market share is 21.4%. Ignoring any other factors, if the company has six shipping errors this month and an average of 3.5 days from ordered to delivered, determine (a) the new customer retention rate and (b) the new market share that Rizzo Goal Inc. expects to have.arrow_forward
- Measure Maps Silver Lining Inc. has a balanced scorecard with a strategy map that shows that delivery time and the number of erroneous shipments are expected to affect the company’s ability to satisfy the customer. Further, the strategy map for the balanced scorecard shows that the hours from ordered to delivered affects the percentage of customers who shop again, and the number of erroneous shipments affects the online customer satisfaction rating. The following information is also available: The company’s target hours from ordered to delivered is 30. Every hour over the ordered-to-delivered target results in a 0.5% decrease in the percentage of customers who shop again. The company’s target number of erroneous shipments per year is no more than 55. Every error over the erroneous shipments target results in a 0.5 point decrease in the online customer satisfaction rating and an added future financial loss of $600. The company estimates that for every 1% decrease in the percentage of…arrow_forwardThe Paymore Rental Car Agency rents cars in a small town. It wants to determine how many rental cars it should maintain. Based on market projections and historical data, the manager has determined probability distributions for the number of rentals per day and rental duration (in days only) as shown in the following tables: Number of customers per day Probability 0 .20 1 .20 2 .50 3 .10 Rental duration in days Probability 1 .10 2 .30 3 .40 4 .10 5 .10 Design a simulation experiment for the car agency and simulate using a fleet of four rental cars for 10 days. Compute the probability that the agency will not have a car available upon demand. Should the agency expand its fleet? Explain how a simulation experiment could be designed to determine the optimal fleet size for the Paymore Agency. Use the following random numbers in order (from left to right) for the simulation of number of customers per day: 0.62 0.48 0.96 0.86 0.86 0.29 0.79 0.22 0.08 0.62…arrow_forwardMeasure Maps Silver Lining Inc. has a balanced scorecard with a strategy map that shows that delivery time and the number of erroneous shipments are expected to affect the company’s ability to satisfy the customer. Further, the strategy map for the balanced scorecard shows that the hours from ordered to delivered affects the percentage of customers who shop again, and the number of erroneous shipments affects the online customer satisfaction rating. The following information is also available: The company’s target hours from ordered to delivered is 20. Every hour over the ordered-to-delivered target results in a 0.5% decrease in the percentage of customers who shop again. The company’s target number of erroneous shipments per year is no more than 55. Every error over the erroneous shipments target results in a 0.5 point decrease in the online customer satisfaction rating and an added future financial loss of $800. The company estimates that for every 1% decrease in the percentage of…arrow_forward
- The controller of Emery, Inc. has computed quality costs as a percentage of sales for the past 5 years (20X1 was the first year the company implemented a quality improvement program). This information is as follows: Required: 1. Prepare a trend graph for total quality costs. Comment on what the graph has to say about the success of the quality improvement program. 2. Prepare a graph that shows the trend for each quality cost category. What does the graph have to say about the success of the quality improvement program? Does this graph supply more insight than the total cost trend graph does? 3. Prepare a graph that compares the trend in relative control costs versus relative failure costs. Comment on the significance of this trend.arrow_forwardDeMarco Company is developing a cost formula for its packing activity. Discussion with the workers in the Packing Department has revealed that packing costs are associated with the number of customer orders, the size of the orders, and the relative fragility of the items (more fragile items must be specially wrapped in bubble wrap and Styrofoam). Data for the past 20 months have been gathered: Required: 1. Using the method of least squares, run a regression using the number of orders as the independent variable. 2. Run a multiple regression using three independent variables: the number of orders, the weight of orders, and the number of fragile items. Which regression equation is better? Why? 3. Predict the total packing cost for 25,000 orders, weighing 40,000 pounds, with 4,000 fragile items.arrow_forwardThe Port Authority sells a wide variety of cables and adapters for electronic equipment online. Last year the mean value of orders placed with the Port Authority was 47.28, and management wants to assess whether the mean value of orders placed to date this year is the same as last year. The values of a sample of 49,896 orders placed this year are collected and recorded in the tile PortAuthority. a. Formulate hypotheses that can be used to test whether the mean value of orders placed this year differs from the mean value of orders placed last year. b. Use the data in the file PortAuthority to conduct your hypothesis test. What is the p value for your hypothesis test? At = 0.01, what is your conclusion?arrow_forward
 Managerial AccountingAccountingISBN:9781337912020Author:Carl Warren, Ph.d. Cma William B. TaylerPublisher:South-Western College Pub
 Cornerstones of Cost Management (Cornerstones Ser...AccountingISBN:9781305970663Author:Don R. Hansen, Maryanne M. MowenPublisher:Cengage Learning
 Excel Applications for Accounting PrinciplesAccountingISBN:9781111581565Author:Gaylord N. SmithPublisher:Cengage Learning
 Essentials of Business Analytics (MindTap Course ...StatisticsISBN:9781305627734Author:Jeffrey D. Camm, James J. Cochran, Michael J. Fry, Jeffrey W. Ohlmann, David R. AndersonPublisher:Cengage Learning
 Managerial Accounting: The Cornerstone of Busines...AccountingISBN:9781337115773Author:Maryanne M. Mowen, Don R. Hansen, Dan L. HeitgerPublisher:Cengage Learning