Concept explainers
Videos
Purchasing department cost drivers, activity-based costing, simple regression analysis. Perfect Fit operates a chain of 10 retail department stores. Each department store makes its own purchasing decisions. Carl Hart, assistant to the president of Perfect Fit, is interested in better understanding the drivers of purchasing department costs. For many years, Perfect Fit has allocated purchasing department costs to products on the basis of the dollar value of merchandise purchased. A $100 item is allocated 10 times as many overhead costs associated with the purchasing department as a $10 item.
Hart recently attended a seminar titled “Cost Drivers in the Retail Industry.” In a presentation at the seminar, Kaliko Fabrics, a leading competitor that has implemented activity-based costing, reported number of purchase orders and number of suppliers to be the two most important cost drivers of purchasing department costs. The dollar value of merchandise purchased in each purchase order was not found to be a significant cost driver. Hart interviewed several members of the purchasing department at the Perfect Fit store in Miami. They believed that Kaliko Fabrics’ conclusions also applied to their purchasing department.
Hart collects the following data for the most recent year for Perfect Fit’s 10 retail department stores:
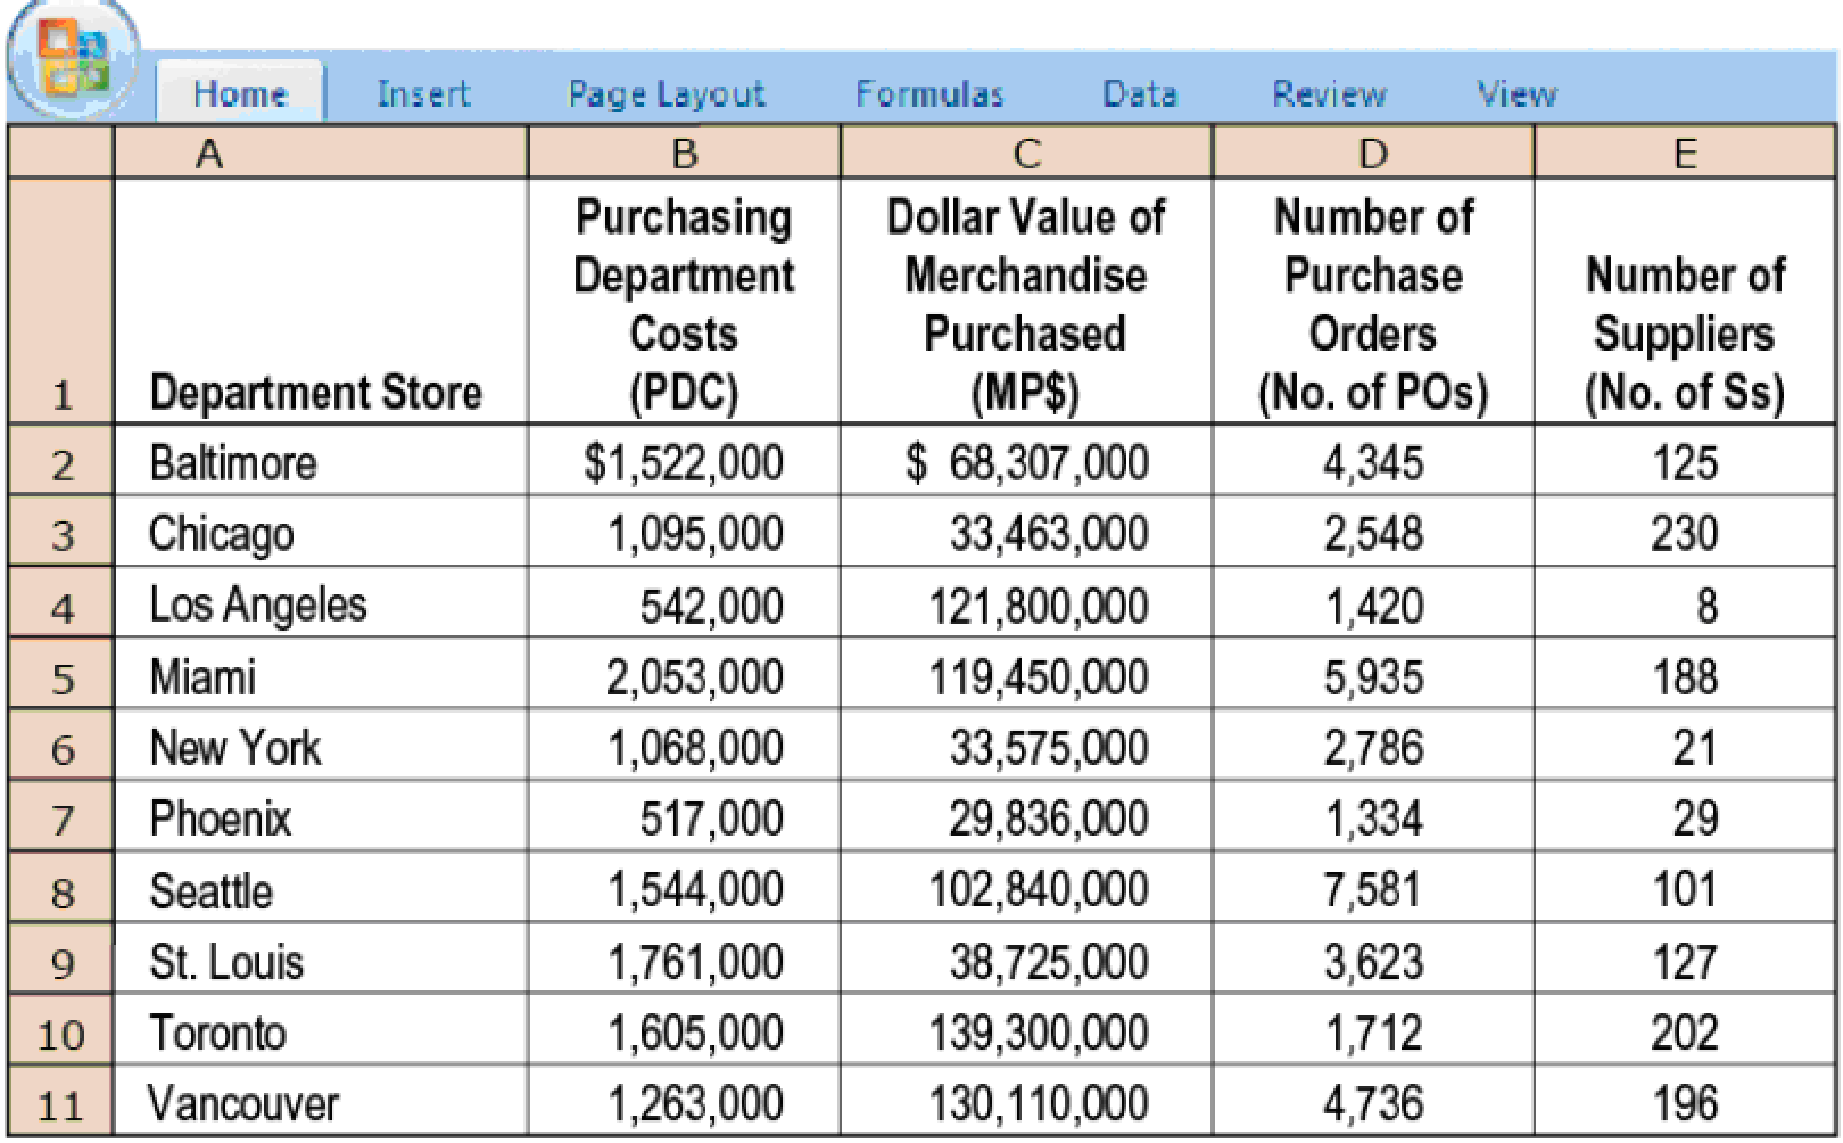
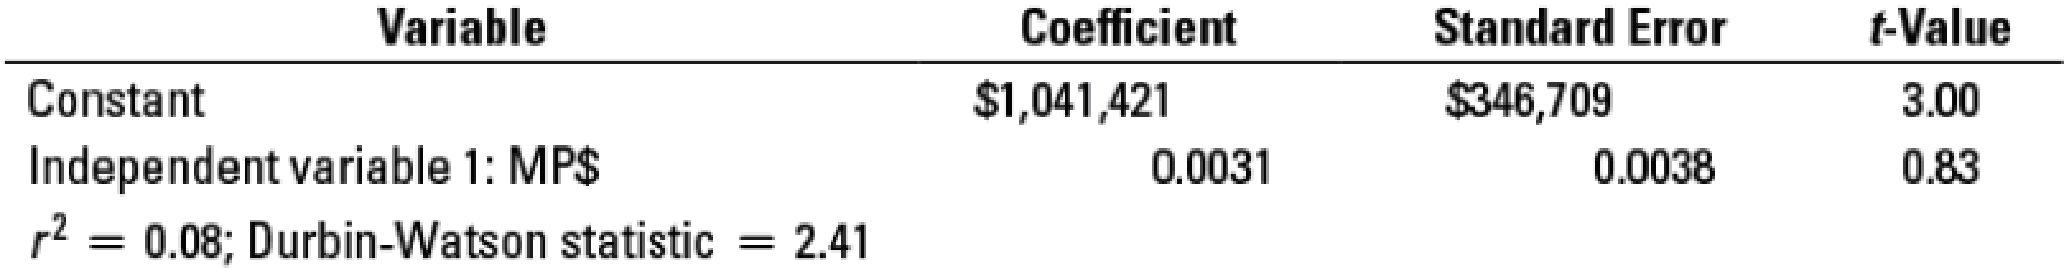
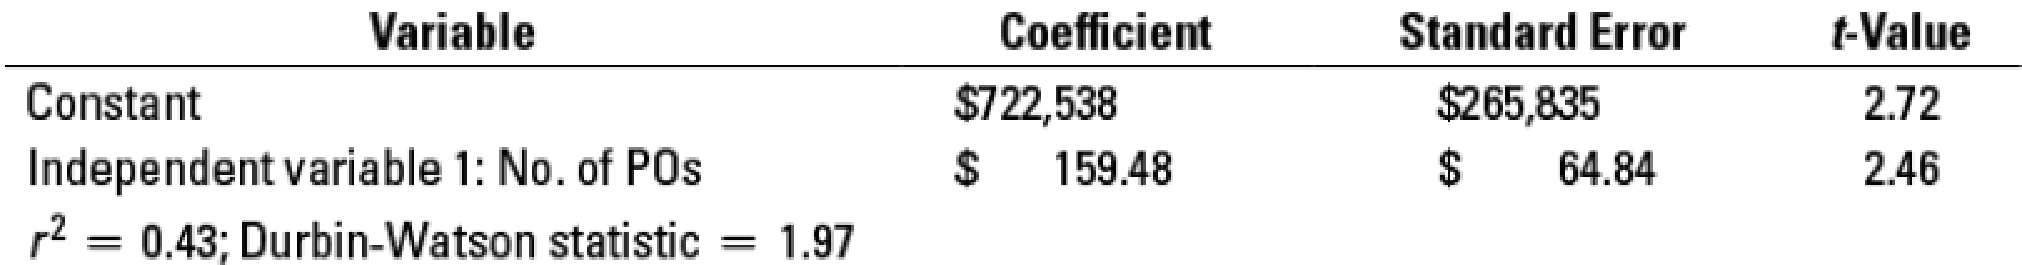
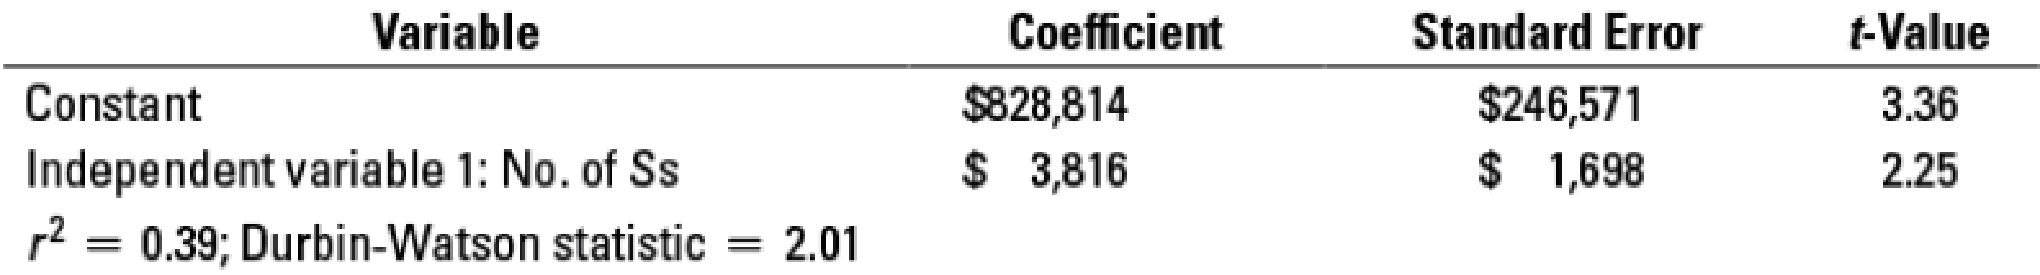
Hart decides to use simple regression analysis to examine whether one or more of three variables (the last three columns in the table) are cost drivers of purchasing department costs. Summary results for these regressions are as follows:
Regression 1: PDC = a + (b × MP$)
Regression 2: PDC = a + (b × No. of POs)
Regression 3: PDC = a + (b × No. of Ss)
- 1. Compare and evaluate the three simple regression models estimated by Hart. Graph each one. Also, use the format employed in Figure 10-18 (page 406) to evaluate the information.
- 2. Do the regression results support the Kaliko Fabrics’ presentation about the purchasing department’s cost drivers? Which of these cost drivers would you recommend in designing an ABC system?
- 3. How might Hart gain additional evidence on drivers of purchasing department costs at each of Perfect Fit’s stores?
Want to see the full answer?
Check out a sample textbook solution
Chapter 10 Solutions
EBK HORNGREN'S COST ACCOUNTING


- Corazon Manufacturing Company has a purchasing department staffed by five purchasing agents. Each agent is paid 28,000 per year and is able to process 4,000 purchase orders. Last year, 17,800 purchase orders were processed by the five agents. Required: 1. Calculate the activity rate per purchase order. 2. Calculate, in terms of purchase orders, the: a. total activity availability b. unused capacity 3. Calculate the dollar cost of: a. total activity availability b. unused capacity 4. Express total activity availability in terms of activity capacity used and unused capacity. 5. What if one of the purchasing agents agreed to work half time for 14,000? How many purchase orders could be processed by four and a half purchasing agents? What would unused capacity be in purchase orders?arrow_forwardThe Chocolate Baker specializes in chocolate baked goods. The firm has long assessed the profitability of a product line by comparing revenues to the cost of goods sold. However, Barry White, the firms new accountant, wants to use an activity-based costing system that takes into consideration the cost of the delivery person. Following are activity and cost information relating to two of Chocolate Bakers major products: Using activity-based costing, which of the following statements is correct? a. The muffins are 2,000 more profitable. b. The cheesecakes are 75 more profitable. c. The muffins are 1,925 more profitable. d. The muffins have a higher profitability as a percentage of sales and, therefore, are more advantageous.arrow_forwardProduct costing and decision analysis for a service company Blue Star Airline provides passenger airline service, using small jets. The airline connects four major cities: Charlotte, Pittsburgh, Detroit, and San Francisco. The company expects to fly 170,000 miles during a month. The following costs are budgeted for a month: Blue Star management wishes to assign these costs to individual flights in order to gauge the profitability of its service offerings. The following activity bases were identified with the budgeted costs: The size of the companys ground operation in each city is determined by the size of the workforce. The following monthly data are available from corporate records for each terminal operation: Three recent representative flights have been selected for the profitability study. Their characteristics are as follows: Instructions Determine the fuel, crew, and depreciation cost per mile flown. Determine the cost per arrival or departure by terminal city. Use the information in (1) and (2) to construct a profitability report for the three flights. Each flight has a single arrival and departure to its origin and destination city pairs.arrow_forward
- Jolene Askew, manager of Feagan Company, has committed her company to a strategically sound cost reduction program. Emphasizing life-cycle cost management is a major part of this effort. Jolene is convinced that production costs can be reduced by paying more attention to the relationships between design and manufacturing. Design engineers need to know what causes manufacturing costs. She instructed her controller to develop a manufacturing cost formula for a newly proposed product. Marketing had already projected sales of 25,000 units for the new product. (The life cycle was estimated to be 18 months. The company expected to have 50 percent of the market and priced its product to achieve this goal.) The projected selling price was 20 per unit. The following cost formula was developed: Y=200,000+10X1 where X1=Machinehours(Theproductisexpectedtouseonemachinehourforeveryunitproduced.) Upon seeing the cost formula, Jolene quickly calculated the projected gross profit to be 50,000. This produced a gross profit of 2 per unit, well below the targeted gross profit of 4 per unit. Jolene then sent a memo to the Engineering Department, instructing them to search for a new design that would lower the costs of production by at least 50,000 so that the target profit could be met. Within two days, the Engineering Department proposed a new design that would reduce unit-variable cost from 10 per machine hour to 8 per machine hour (Design Z). The chief engineer, upon reviewing the design, questioned the validity of the controllers cost formula. He suggested a more careful assessment of the proposed designs effect on activities other than machining. Based on this suggestion, the following revised cost formula was developed. This cost formula reflected the cost relationships of the most recent design (Design Z). Y=140,000+8X1+5,000X2+2,000X3 where X1=MachinehoursX2=NumberofbatchesX3=Numberofengineeringchangeorders Based on scheduling and inventory considerations, the product would be produced in batches of 1,000; thus, 25 batches would be needed over the products life cycle. Furthermore, based on past experience, the product would likely generate about 20 engineering change orders. This new insight into the linkage of the product with its underlying activities led to a different design (Design W). This second design also lowered the unit-level cost by 2 per unit but decreased the number of design support requirements from 20 orders to 10 orders. Attention was also given to the setup activity, and the design engineer assigned to the product created a design that reduced setup time and lowered variable setup costs from 5,000 to 3,000 per setup. Furthermore, Design W also creates excess activity capacity for the setup activity, and resource spending for setup activity capacity can be decreased by 40,000, reducing the fixed cost component in the equation by this amount. Design W was recommended and accepted. As prototypes of the design were tested, an additional benefit emerged. Based on test results, the post-purchase costs dropped from an estimated 0.70 per unit sold to 0.40 per unit sold. Using this information, the Marketing Department revised the projected market share upward from 50 percent to 60 percent (with no price decrease). Required: 1. Calculate the expected gross profit per unit for Design Z using the controllers original cost formula. According to this outcome, does Design Z reach the targeted unit profit? Repeat, using the engineers revised cost formula. Explain why Design Z failed to meet the targeted profit. What does this say about the use of unit-based costing for life-cycle cost management? 2. Calculate the expected profit per unit using Design W. Comment on the value of activity information for life-cycle cost management. 3. The benefit of the post-purchase cost reduction of Design W was discovered in testing. What direct benefit did it create for Feagan Company (in dollars)? Reducing post-purchase costs was not a specific design objective. Should it have been? Are there any other design objectives that should have been considered?arrow_forwardHart Manufacturing makes three products. Each product requires manufacturing operations in three departments: A, B, and C. The labor-hour requirements, by department, are as follows: During the next production period the labor-hours available are 450 in department A, 350 in department B, and 50 in department C. The profit contributions per unit are 25 for product 1, 28 for product 2, and 30 for product 3. a. Formulate a linear programming model for maximizing total profit contribution. b. Solve the linear program formulated in part (a). How much of each product should be produced, and what is the projected total profit contribution? c. After evaluating the solution obtained in part (b), one of the production supervisors noted that production setup costs had not been taken into account. She noted that setup costs are 400 for product 1, 550 for product 2, and 600 for product 3. If the solution developed in part (b) is to be used, what is the total profit contribution after taking into account the setup costs? d. Management realized that the optimal product mix, taking setup costs into account, might be different from the one recommended in part (b). Formulate a mixed-integer linear program that takes setup costs provided in part (c) into account. Management also stated that we should not consider making more than 175 units of product 1, 150 units of product 2, or 140 units of product 3. e. Solve the mixed-integer linear program formulated in part (d). How much of each product should be produced and what is the projected total profit contribution? Compare this profit contribution to that obtained in part (c).arrow_forwardQuality Cost Report Loring Company had total sales of 2,400,000 for fiscal 20X1. The costs of quality-related activities are given below. Required: 1. Prepare a quality cost report, classifying costs by category and expressing each category as a percentage of sales. What message does the cost report provide? 2. Prepare a bar graph and pie chart that illustrate each categorys contribution to total quality costs. Comment on the significance of the distribution.arrow_forward
- Scattergraph, High-Low Method, and Predicting Cost for a Different Time Period from the One Used to Develop a Cost Formula Refer to the information for Farnsworth Company on the previous page. Required: 1. Prepare a scattergraph based on the 10 months of data. Does the relationship appear to be linear? 2. Using the high-low method, prepare a cost formula for the receiving activity. Using this formula, what is the predicted cost of receiving for a month in which 1,450 receiving orders are processed? 3. Prepare a cost formula for the receiving activity for a quarter. Based on this formula, what is the predicted cost of receiving for a quarter in which 4,650 receiving orders are anticipated? Prepare a cost formula for the receiving activity for a year. Based on this formula, what is the predicted cost of receiving for a year in which 18,000 receiving orders are anticipated? Use the following information for Problems 3-60 and 3-61: Farnsworth Company has gathered data on its overhead activities and associated costs for the past 10 months. Tracy Heppler, a member of the controllers department, has convinced management that overhead costs can be better estimated and controlled if the fixed and variable components of each overhead activity are known. One such activity is receiving raw materials (unloading incoming goods, counting goods, and inspecting goods), which she believes is driven by the number of receiving orders. Ten months of data have been gathered for the receiving activity and are as follows:arrow_forwardBig Mikes, a large hardware store, has gathered data on its overhead activities and associated costs for the past 10 months. Nizam Sanjay, a member of the controllers department, believes that overhead activities and costs should be classified into groups that have the same driver. He has decided that unloading incoming goods, counting goods, and inspecting goods can be grouped together as a more general receiving activity, since these three activities are all driven by the number of receiving orders. The 10 months of data shown below have been gathered for the receiving activity. Required: 1. Prepare a scattergraph, plotting the receiving costs against the number of purchase orders. Use the vertical axis for costs and the horizontal axis for orders. 2. Select two points that make the best fit, and compute a cost formula for receiving costs. 3. Using the high-low method, prepare a cost formula for the receiving activity. 4. Using the method of least squares, prepare a cost formula for the receiving activity. What is the coefficient of determination?arrow_forwardVentana Window and Wall Treatments Company provides draperies, shades, and various window treatments. Ventana works with the customer to design the appropriate window treatment, places the order, and installs the finished product. Direct materials and direct labor costs are easy to trace to the jobs. Ventanas income statement for last year is as follows: Ventana wants to find a markup on cost of goods sold that will allow them to earn about the same amount of profit on each job as was earned last year. Required: 1. What is the markup on cost of goods sold (COGS) that will maintain the same profit as last year? (Round the percentage to two significant digits.) 2. A customer orders draperies and shades for a remodeling job. The job will have the following costs: What is the price that Ventana will quote given the markup percentage calculated in Requirement 1? (Round the price to the nearest dollar.) 3. What if Ventana wants to calculate a markup on direct materials cost, since it is the largest cost of doing business? What is the markup on direct materials cost that will maintain the same profit as last year? (Round the percentage to two significant digits.) What is the bid price Ventana will use for the job given in Requirement 2 if the markup percentage is calculated on the basis of direct materials cost? (Round to the nearest dollar.)arrow_forward
- Evaluating selling and administrative cost allocations Gordon Gecco Furniture Company has two major product lines with the following characteristics: Commercial office furniture: Few large orders, little advertising support, shipments in full truckloads, and low handling complexity Home office furniture: Many small orders, large advertising support, shipments in partial truckloads, and high handling complexity The company produced the following profitability report for management: The selling and administrative expenses are allocated to the products on the basis of relative sales dollars. Evaluate the accuracy of this report and recommend an alternative approach.arrow_forwardFunctional-Based versus Activity-Based Costing For years, Tamarindo Company produced only one product: backpacks. Recently, Tamarindo added a line of duffel bags. With this addition, the company began assigning overhead costs by using departmental rates. (Prior to this, the company used a predetermined plantwide rate based on units produced.) Surprisingly, after the addition of the duffel-bag line and the switch to departmental rates, the costs to produce the backpacks increased, and their profitability dropped. Josie, the marketing manager, and Steve, the production manager, both complained about the increase in the production cost of backpacks. Josie was concerned because the increase in unit costs led to pressure to increase the unit price of backpacks. She was resisting this pressure because she was certain that the increase would harm the companys market share. Steve was receiving pressure to cut costs also, yet he was convinced that nothing different was being done in the way the backpacks were produced. After some discussion, the two managers decided that the problem had to be connected to the addition of the duffel-bag line. Upon investigation, they were informed that the only real change in product-costing procedures was in the way overhead costs are assigned. A two-stage procedure was now in use. First, overhead costs are assigned to the two producing departments, Patterns and Finishing. Second, the costs accumulated in the producing departments are assigned to the two products by using direct labor hours as a driver (the rate in each department is based on direct labor hours). The managers were assured that great care was taken to associate overhead costs with individual products. So that they could construct their own example of overhead cost assignment, the controller provided them with the information necessary to show how accounting costs are assigned to products: The controller remarked that the cost of operating the accounting department had doubled with the addition of the new product line. The increase came because of the need to process additional transactions, which had also doubled in number. During the first year of producing duffel bags, the company produced and sold 100,000 backpacks and 25,000 duffel bags. The 100,000 backpacks matched the prior years output for that product. Required: (Note: Round rates and unit cost to the nearest cent.) 1. CONCEPTUAL CONNECTION Compute the amount of accounting cost assigned to a backpack before the duffel-bag line was added by using a plantwide rate approach based on units produced. Is this assignment accurate? Explain. 2. Suppose that the company decided to assign the accounting costs directly to the product lines by using the number of transactions as the activity driver. What is the accounting cost per unit of backpacks? Per unit of duffel bags? 3. Compute the amount of accounting cost assigned to each backpack and duffel bag by using departmental rates based on direct labor hours. 4. CONCEPTUAL CONNECTION Which way of assigning overhead does the best jobthe functional-based approach by using departmental rates or the activity-based approach by using transactions processed for each product? Explain. Discuss the value of ABC before the duffel-bag line was added.arrow_forwardProduct costing and decision analysis for a service company Pleasant Stay Medical Inc. wishes to determine its product costs. Pleasant Stay offers a variety of medical procedures (operations) that are considered its products. The overhead has been separated into three major activities. The annual estimated activity costs and activity bases follow: Total patient days are determined by multiplying the number of patients by the average length of stay in the hospital. A weighted care unit (wcu) is a measure of nursing effort used to care for patients. There were 192,000 weighted care units estimated for the year. In addition, Pleasant Stay estimated 6,000 patients and 27,000 patient days for the year. (The average patient is expected to have a a little more than a four-day stay in the hospital.) During a portion of the year, Pleasant Stay collected patient information for three selected procedures, as follows: Private insurance reimburses the hospital for these activities at a fixed daily rate of 406 per patient day for all three procedures. Instructions Determine the activity rates. Determine the activity cost for each procedure. Determine the excess or deficiency of reimbursements to activity cost. Interpret your results.arrow_forward
 Cornerstones of Cost Management (Cornerstones Ser...AccountingISBN:9781305970663Author:Don R. Hansen, Maryanne M. MowenPublisher:Cengage Learning
 Managerial AccountingAccountingISBN:9781337912020Author:Carl Warren, Ph.d. Cma William B. TaylerPublisher:South-Western College Pub
 Managerial Accounting: The Cornerstone of Busines...AccountingISBN:9781337115773Author:Maryanne M. Mowen, Don R. Hansen, Dan L. HeitgerPublisher:Cengage Learning
 Financial And Managerial AccountingAccountingISBN:9781337902663Author:WARREN, Carl S.Publisher:Cengage Learning,
 Essentials of Business Analytics (MindTap Course ...StatisticsISBN:9781305627734Author:Jeffrey D. Camm, James J. Cochran, Michael J. Fry, Jeffrey W. Ohlmann, David R. AndersonPublisher:Cengage Learning