Managerial Accounting Plus Mylab Accounting With Pearson Etext -- Access Card Package (5th Edition)
5th Edition
ISBN: 9780134641805
Author: Braun
Publisher: PEARSON
expand_more
expand_more
format_list_bulleted
Videos
Textbook Question
Chapter 10, Problem 10.48AP
Evaluate subunit performance (Learning Objectives 2 & 6)
One subunit of Carlton Sports Company had the following financial results last month:
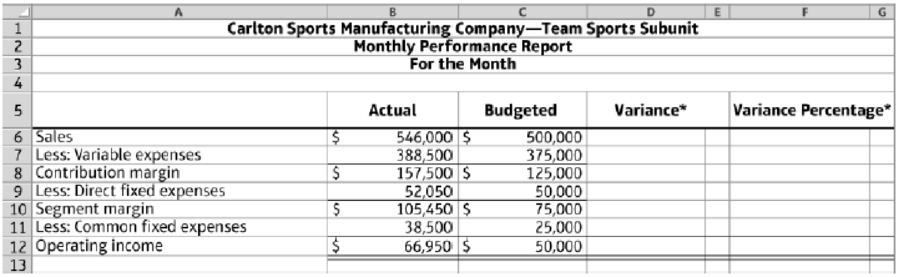
*Be sure to indicate whether each variance is favorable (F) or unfavorable (U).
Requirements
- 1. Complete the performance evaluation report for this subunit (round to three decimal places).
- 2. Based on the data presented, what type of responsibility center is this subunit?
- 3. Which items should be investigated if part of the management’s decision criteria is to investigate all variances equal to or exceeding $13,500 and exceeding 16% (both criteria must be met)?
- 4. Should only unfavorable variances be investigated? Explain.
- 5. Is it possible that the variances are due to a higher-than-expected sales volume? Explain.
- 6. Do you think management will place equal weight on each of the $13,500 variances? Explain.
- 7. Which balanced scorard perspective is being addressed through this performance report? In your opinion, is this performance report a lead or lag indicator? Explain.
- 8. Give one key performance indicator for the other three balanced scorecard perspectives. Indicate which perspective is being addressed by the indicator you list. Are they lead or lag indicators? Explain.
Expert Solution & Answer
Want to see the full answer?
Check out a sample textbook solution
Students have asked these similar questions
Taylor Consulting makes it a practice to stay involved with the client to help them stay on track to achieve their goals. A co-worker had completed the balanced scorecard for Buckeye Electric six months ago. Your manager has instructed you to consult with Buckeye Electric management regarding any balanced scorecard item whose performance metric has achieved less than 50% of the target. Determine which Performance Metrics require a consultation. Also, indicate the Performance Perspective for each Performance Metric. This information is important because you will need to know which manager to contact.
Performance Metrics
Last Year
Target
Year to Date Consultation
Required
Performance Perspective
1. Revenue growth rate 14.0% 15.0% 14.6%
2. Utilization of asset rate 6.0% 12.0% 7.0%
3. Operating costs per customer $150 $125 $145
4. Customer satisfaction rating 80.0% 87.0% 90.0%
5. Problem resolution time 6 hr 3 hr 4 hr
6. Employee productivity rate 2.0% 3.0% 2.4%
7.…
Integrating decentralization and performance evaluation systems
One subunit of Track Sports Company had the following financial results last month:
Requirements
Complete the performance evaluation report for this subunit (round to two decimal places).
Based on the data presented and your knowledge of the company, what type of responsibility center is this subunit?
Which items should be investigated if part of management’s decision criteria is to investigate all variances equal to or exceeding $8,000 arm’ exceeding 10% (both criteria must be met)?
Should only unfavorable variances be investigated? Explain.
Is it possible that the variances are due to a higher-than-expected sales volume? Explain.
Will management place equal weight on each of the variances exceeding $8,000? Explain.
Which balanced scorecard perspective is being addressed through this performance report? In your opinion, is this performance report a lead or a lag indicator? Explain.
List one key performance indicator for…
Using responsibility reports to evaluate cost, revenue, and profit centers
The accountant for a subunit of Speed Sports Company went on vacation before completing the subunit’s monthly responsibility report. This is as far as she got:
Requirements
Complete the responsibility report for this subunit.
Based on the data presented, what type of responsibility center is this Subunit.
Which items should be investigated if part of management’s decision criteria is to investigate all variances exceeding $12,000?
Chapter 10 Solutions
Managerial Accounting Plus Mylab Accounting With Pearson Etext -- Access Card Package (5th Edition)
Ch. 10 - (Learning Objective 1) Companies often...Ch. 10 - (Learning Objective 1) Which of the following is...Ch. 10 - (Learning Objective 1) In terms of responsibility...Ch. 10 - (Learning Objective 2) Which of the following is...Ch. 10 - (Learning Objective 2) A segment margin is the...Ch. 10 - Prob. 6QCCh. 10 - Prob. 7QCCh. 10 - Prob. 8QCCh. 10 - Prob. 9QCCh. 10 - Prob. 10QC
Ch. 10 - Identify and understand responsibility centers...Ch. 10 - Identify types of responsibility centers (Learning...Ch. 10 - Identify centralized and decentralized...Ch. 10 - Prob. 10.4SECh. 10 - Prob. 10.5SECh. 10 - Prob. 10.6SECh. 10 - Calculate ROI (Learning Objective 3) Refer to Epic...Ch. 10 - Prob. 10.8SECh. 10 - Prob. 10.9SECh. 10 - Prob. 10.10SECh. 10 - Prob. 10.11SECh. 10 - Interpret a performance report (Learning Objective...Ch. 10 - Prob. 10.13SECh. 10 - Classify KPIs by balanced scorecard perspective...Ch. 10 - Use vocabulary terms (Learning Objectives 1, 2, 3,...Ch. 10 - Prob. 10.16SECh. 10 - Identify type of responsibility center (Learning...Ch. 10 - Complete and analyze a performance report...Ch. 10 - Prepare a segment margin performance report...Ch. 10 - Compute and interpret the expanded ROI equation...Ch. 10 - Prob. 10.21AECh. 10 - Prob. 10.22AECh. 10 - Comparison of ROI and residual income (Learning...Ch. 10 - Prob. 10.24AECh. 10 - Comprehensive flexible budget problem (Learning...Ch. 10 - Prepare a flexible budget performance report...Ch. 10 - Work backward to find missing values (Learning...Ch. 10 - Construct a balanced scorecard (Learning Objective...Ch. 10 - Sustainability and the balanced scorecard...Ch. 10 - Identify type of responsibility center (Learning...Ch. 10 - Complete and analyze a performance report...Ch. 10 - Prob. 10.32BECh. 10 - Prob. 10.33BECh. 10 - Prob. 10.34BECh. 10 - Prob. 10.35BECh. 10 - Prob. 10.36BECh. 10 - Prob. 10.37BECh. 10 - Prob. 10.38BECh. 10 - Prob. 10.39BECh. 10 - Prob. 10.40BECh. 10 - Prob. 10.41BECh. 10 - Sustainability and the balanced scorecard...Ch. 10 - Prepare a budget with different volumes for...Ch. 10 - Prepare and interpret a performance report...Ch. 10 - Prob. 10.45APCh. 10 - Prob. 10.46APCh. 10 - Prob. 10.47APCh. 10 - Evaluate subunit performance (Learning Objectives...Ch. 10 - Prob. 10.49BPCh. 10 - Prob. 10.50BPCh. 10 - Evaluate divisional performance (Learning...Ch. 10 - Prob. 10.52BPCh. 10 - Determine transfer price at a manufacturer under...Ch. 10 - Evaluate subunit performance (Learning Objectives...Ch. 10 - Prob. 10.55SC
Knowledge Booster


Learn more about
Need a deep-dive on the concept behind this application? Look no further. Learn more about this topic, accounting and related others by exploring similar questions and additional content below.Similar questions
- Eye Swear Inc. has a balanced scorecard that includes the following relationships: Actual results for this year and last year are as follows: Instructions 1.Analyze these statistics to verify whether they support the expected relationships between the strategic objectives and performance metrics. 2.Identify three possible reasons for any unsupported relationship you identified in part (1). 3.Which of the three possibilities you identified in part (2) is the most likely reason for the unsupported relationship you identified in part (1)?arrow_forwardThe following if-then statements were taken from a Balanced Scorecard: a. If employee capabilities increase, then process time decreases. b. If process time decreases, then customer retention will increase. c. If customer retention increases, then market share will increase. d. If market share increases, then revenues will increase. Required: 1. Identify the lead and lag variables, and explain your reasoning. 2. Discuss the implications of Requirement 1 for the financial and learning and growth perspectives. 3. Using the first if-then statement, explain the concept of double-loop feedback.arrow_forwardCarson Wellington, president of Mallory Plastics, was considering a report sent to him by Emily Sorensen, vice president of operations. The report was a summary of the progress made by an activity-based management system that was implemented three years ago. Significant progress had indeed been realized. At the conclusion of the report, Emily urged Carson to consider the adoption of the Balanced Scorecard as a logical next step in the companys efforts to establish itself as a leader in its industry. Emily clearly was impressed by the Balanced Scorecard and intrigued by the possibility that the change would enhance the overall competitiveness of Mallory. She requested a meeting of the executive committee to explain the similarities and differences between the two approaches. Carson agreed to schedule the meeting but asked Emily to prepare a memo in advance, listing the most important similarities and differences between the two approaches to responsibility accounting. Required: Prepare the memo requested by Carson.arrow_forward
- At the end of 20x1, Mejorar Company implemented a low-cost strategy to improve its competitive position. Its objective was to become the low-cost producer in its industry. A Balanced Scorecard was developed to guide the company toward this objective. To lower costs, Mejorar undertook a number of improvement activities such as JIT production, total quality management, and activity-based management. Now, after two years of operation, the president of Mejorar wants some assessment of the achievements. To help provide this assessment, the following information on one product has been gathered: Required: 1. Compute the following measures for 20x1 and 20x3: a. Actual velocity and cycle time b. Percentage of total revenue from new customers (assume one unit per customer) c. Percentage of very satisfied customers (assume each customer purchases one unit) d. Market share e. Percentage change in actual product cost (for 20x3 only) f. Percentage change in days of inventory (for 20x3 only) g. Defective units as a percentage of total units produced h. Total hours of training i. Suggestions per production worker j. Total revenue k. Number of new customers 2. For the measures listed in Requirement 1, list likely strategic objectives, classified according to the four Balance Scorecard perspectives. Assume there is one measure per objective.arrow_forwardA marketing professor at Givens College is interested in the relationship between hours spent studying and total points earned in a course. Data collected on 156 students who took the course last semester are provided in the tile MktHrsPts. Develop a scatter chart for these data. What does the scatter chart indicate about the relationship between total points earned and hours spent studying? Develop an estimated regression equation showing how total points earned is related to hours spent studying. What is the estimated regression model? Test whether each of the regression parameters β0 and β1 is equal to zero at a 0.01 level of significance. What are the correct interpretations of the estimated regression parameters? Are these interpretations reasonable? How much of the variation in the sample values of total point earned does the model you estimated in part (b) explain? Mark Sweeney spent 95 hours studying. Use the regression model you estimated in part (b) to predict the total points Mark earned.arrow_forwardMerkley Company, a manufacturer of machine parts, implemented lean manufacturing at the end of 20X1. Three value streams were established: one for new product development and two order fulfillment value streams. One of the value streams set a goal to increase its ROS to 45% of sales by the end of the year. During the year, the value stream made significant improvements in several areas. The Box Scorecard below was prepared, with performance measures for the beginning of the year, midyear, and end of year. Although the members of the value stream were pleased with their progress, they were disappointed in the financial results. They were still far from the targeted ROS of 45%. They were also puzzled as to why the improvements made did not translate into significantly improved financial performance. Required: 1. From the scorecard, what was the focus of the value-stream team for the first 6 months? The second 6 months? What are the implications of these changes? 2. Using information from the scorecard, offer an explanation for why the financial results were not as good as expected.arrow_forward
- Determine if the selection of system 1 or 2 is sensitive to variation in the return required by management. The corporate MARR ranges from 8% to16% per year on different projects. Use tabulated factors or a spreadsheet, as requested by your instructor.arrow_forward(J) Citations are required for this exercise. Comments to other students must be detailed and substantive. Alpaca Industries, located in the beauty pacific Northwest, manufactures a household electronic device. The company is fairly small with revenues and total assets of approximately $370,000 and $300,000, respectively. The company has never maintained a budget since its inception, and as a new hire, you are eager to create a budget for the company. Write a 1-page memo, explaining to the owner the advantages of budgeting. In your memo, provide exact page number citations. Please note that any responses without citations will not be graded. Only the original responses are graded; subsequent edits are not graded.arrow_forwardBradford Company, a manufacturer of small tools, implemented lean manufacturing at the end of 20x1. The companys goal for the year was to increase the ROS to 40 percent of sales. A value-stream team was established and began to work on lean improvements. During the year, the team was able to achieve significant results on several fronts. The Box Scorecard below reflects the performance measures at the beginning of the year, midyear, and end of year. Although the team members were pleased with their progress, they were disappointed in the financial results. They were still far from the targeted ROS of 40 percent. They were also puzzled as to why the improvements made did not translate into significantly improved financial performance. Required: 1. From the scorecard, what was the focus of the value-stream team for the first six months? The second six months? What are the implications of these changes? 2. Using information from the scorecard, offer an explanation for why the financial results were not as good as expected. 3. Suppose that on December 31, 20x2, a potential customer offered to purchase an order of goods that would increase weekly revenues in January by 100,000 and material cost by 30,000. Using the old standard cost system, the projected conversion cost of the order would be 60,000. Would you recommend that the order be accepted or rejected? Explain.arrow_forward
- Classify each of the following performance measures into the balanced scorecard perspective to which it relates: financial perspective, internal operations perspective, learning and growth perspective, or customer perspective. A. Employee satisfaction surveys B. Units of waste per production process, uniformity of products and inventory control C. Number of energy-efficient bulbs replaced D. Management training course certificates awarded E. Divisional profit F. Number of customer referralsarrow_forwardScorecard Measures, Strategy Translation At the end of 20x1, Mejorar Company implemented a low-cost strategy to improve its competitive position. Its objective was to become the low-cost producer in its industry. A Balanced Scorecard was developed to guide the company toward this objective. To lower costs, Mejorar undertook a number of improvement activities such as JIT production, total quality management, and activity-based management. Now, after two years of operation, the president of Mejorar wants some assessment of the achievements. To help provide this assessment, the following information on one product has been gathered: 20x1 20x3 Theoretical annual capacity* 249,600 249,600 Actual production** 208,000 234,000 Market size (in units sold) 1,300,000 1,300,000 Production hours available (40 workers) 104,000 104,000 Very satisfied customers 62,400 117,000 Actual cost per unit $340 $272 Days of inventory 14 7 Number of defective…arrow_forwardScorecard Measures, Strategy Translation At the end of 20x1, Mejorar Company implemented a low-cost strategy to improve its competitive position. Its objective was to become the low-cost producer in its industry. A Balanced Scorecard was developed to guide the company toward this objective. To lower costs, Mejorar undertook a number of improvement activities such as JIT production, total quality management, and activity-based management. Now, after two years of operation, the president of Mejorar wants some assessment of the achievements. To help provide this assessment, the following information on one product has been gathered: 20x1 20x3 Theoretical annual capacity* 249,600 249,600 Actual production** 208,000 234,000 Market size (in units sold) 1,300,000 1,300,000 Production hours available (40 workers) 104,000 104,000 Very satisfied customers 62,400 117,000 Actual cost per unit $340 $272 Days of inventory 14 7 Number of defective…arrow_forward
arrow_back_ios
SEE MORE QUESTIONS
arrow_forward_ios
Recommended textbooks for you
 Managerial AccountingAccountingISBN:9781337912020Author:Carl Warren, Ph.d. Cma William B. TaylerPublisher:South-Western College Pub
 Financial And Managerial AccountingAccountingISBN:9781337902663Author:WARREN, Carl S.Publisher:Cengage Learning,
 Principles of Accounting Volume 2AccountingISBN:9781947172609Author:OpenStaxPublisher:OpenStax College
 Cornerstones of Cost Management (Cornerstones Ser...AccountingISBN:9781305970663Author:Don R. Hansen, Maryanne M. MowenPublisher:Cengage Learning
 Excel Applications for Accounting PrinciplesAccountingISBN:9781111581565Author:Gaylord N. SmithPublisher:Cengage Learning
 Managerial Accounting: The Cornerstone of Busines...AccountingISBN:9781337115773Author:Maryanne M. Mowen, Don R. Hansen, Dan L. HeitgerPublisher:Cengage Learning
Managerial Accounting
Accounting
ISBN:9781337912020
Author:Carl Warren, Ph.d. Cma William B. Tayler
Publisher:South-Western College Pub
Financial And Managerial Accounting
Accounting
ISBN:9781337902663
Author:WARREN, Carl S.
Publisher:Cengage Learning,
Principles of Accounting Volume 2
Accounting
ISBN:9781947172609
Author:OpenStax
Publisher:OpenStax College
Cornerstones of Cost Management (Cornerstones Ser...
Accounting
ISBN:9781305970663
Author:Don R. Hansen, Maryanne M. Mowen
Publisher:Cengage Learning
Excel Applications for Accounting Principles
Accounting
ISBN:9781111581565
Author:Gaylord N. Smith
Publisher:Cengage Learning
Managerial Accounting: The Cornerstone of Busines...
Accounting
ISBN:9781337115773
Author:Maryanne M. Mowen, Don R. Hansen, Dan L. Heitger
Publisher:Cengage Learning
Elements of cost | Direct and Indirect: Material, Labor, & Expenses; Author: Educationleaves;https://www.youtube.com/watch?v=UFBaj6AHjHQ;License: Standard youtube license