
EBK HORNGREN'S COST ACCOUNTING
16th Edition
ISBN: 8220103631723
Author: Rajan
Publisher: YUZU
expand_more
expand_more
format_list_bulleted
Videos
Textbook Question
Chapter 10, Problem 10.48P
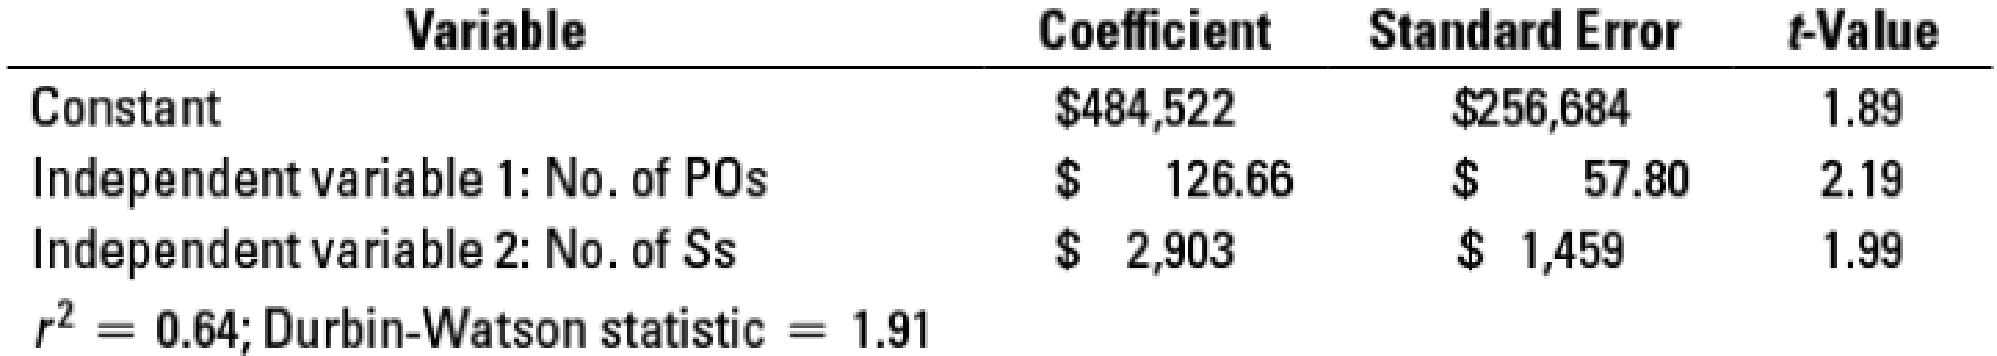
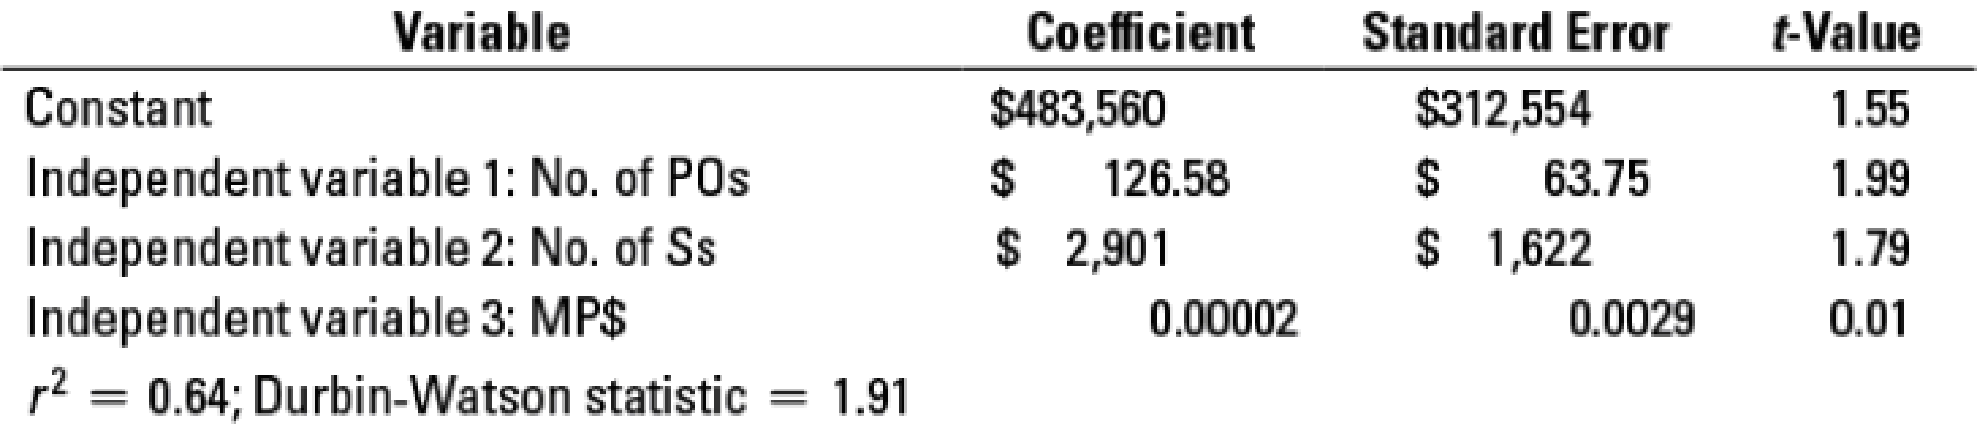
Purchasing department cost drivers, multiple regression analysis (continuation of 10-47). Carl Hart decides that the simple regression analysis used in Problem 10-47 could be extended to a multiple regression analysis. He finds the following results for two multiple regression analyses:
Regression 4: PDC = a + (b1 × No. of POs) + (b2 × No. of Ss)
Regression 5: PDC = a + (b1 × No. of POs) + (b2 × No. of Ss) + (b3 × MP$)
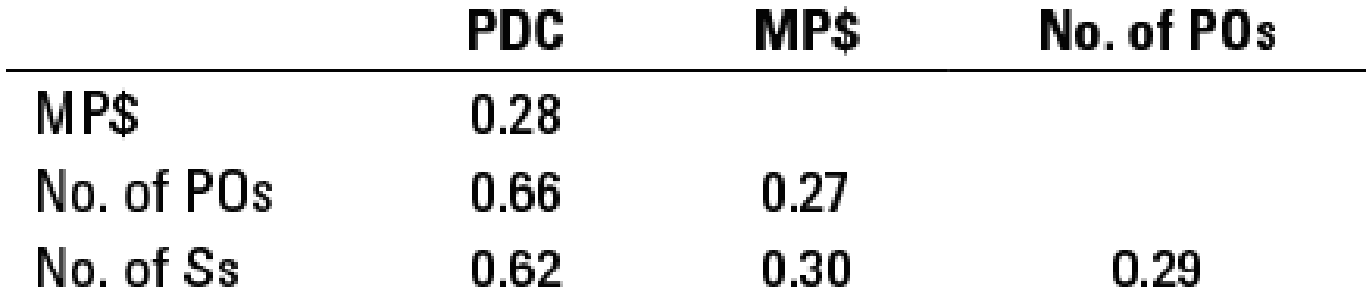
The coefficients of correlation between combinations of pairs of the variables are as follows:
- 1. Evaluate regression 4 using the criteria of economic plausibility, goodness of fit, significance of independent variables, and specification analysis. Compare regression 4 with regressions 2 and 3 in Problem 10-47. Which one of these models would you recommend that Hart use? Why?
Required
- 2. Compare regression 5 with regression 4. Which one of these models would you recommend that Hart use? Why?
- 3. Hart estimates the following data for the Baltimore store for next year: dollar value of merchandise purchased, 578,500,000; number of purchase orders, 4,100; number of suppliers, 110. How much should Hart budget for purchasing department costs for the Baltimore store for next year?
- 4. What difficulties do not arise in simple regression analysis that may arise in multiple regression analysis? Is there evidence of such difficulties in either of the multiple regressions presented in this problem? Explain.
- 5. Give two examples of decisions in which the regression results reported here (and in Problem 10-47) could be informative.
Expert Solution & Answer
Want to see the full answer?
Check out a sample textbook solution
Students have asked these similar questions
Least-Squares Regression Method; Scattergraph; Cost Behavior
Professor John Morton has just been appointed chairperson of the Finance Department at Westland University. In reviewing the department’s cost records. Professor Morton has found the following total cost associated with Finance 101 over the last five terms:
Professor Morton knows that there are some variable costs, such as amounts paid to graduate assistants, associated with the course. He would like to have the variable and fixed costs separated for planning purposes.
Required:
1. Prepare a scattergraph plot. (Plot total cost on the vertical axis and number of sections offered on the horizontal axis.)
2. Using the least-squares regression method, estimate the variable cost per section and the total fixed cost per term for Finance 101. Express these estimates in the form Y = a + bX.
3. Assume that because of the small number of sections offered during the Winter Term this year. Professor Morton will have to offer eight…
Tom uses his computer to calculate the following regression formula:Weekly total costs = $18,791 + ($19.97 * Number of orders per week) Draw the regression line on your graph. Use your graph to evaluate the regression line using the criteria of economic plausibility, goodness of fit, and significance of the independent variable. Is the cost function estimated using the high-low method a close approximation of the cost function estimated using the regression method? Explain briefly.
A manager uses regression to express sales as a function of advertising expenditures (X1), and per capita income (X2) in your sales area. The following multiple linear regression equation is developed:
Y = 10 + 0.51X1 + 0.45X2
The coefficient of determination is 0.96
Determine which of the following conclusions is valid regarding the coefficient of determination:
Multiple Choice
The coefficient of determination should always be greater than one.
More analysis is needed. The coefficient of determination leaves much unexplained.
The coefficient of determination is positive because the constant term is positive.
The regression line fits the data used in the sample very well. There is a strong indication of the relationship of the two variables with sales.
Chapter 10 Solutions
EBK HORNGREN'S COST ACCOUNTING
Ch. 10 - What two assumptions are frequently made when...Ch. 10 - Describe three alternative linear cost functions.Ch. 10 - What is the difference between a linear and a...Ch. 10 - High correlation between two variables means that...Ch. 10 - Name four approaches to estimating a cost...Ch. 10 - Describe the conference method for estimating a...Ch. 10 - Describe the account analysis method for...Ch. 10 - List the six steps in estimating a cost function...Ch. 10 - When using the high-low method, should you base...Ch. 10 - Describe three criteria for evaluating cost...
Ch. 10 - Define learning curve. Outline two models that can...Ch. 10 - Discuss four frequently encountered problems when...Ch. 10 - Prob. 10.13QCh. 10 - All the independent variables in a cost function...Ch. 10 - Multicollinearity exists when the dependent...Ch. 10 - HL Co. uses the high-low method to derive a total...Ch. 10 - A firm uses simple linear regression to forecast...Ch. 10 - In regression analysis, the coefficient of...Ch. 10 - A regression equation is set up, where the...Ch. 10 - What would be the approximate value of the...Ch. 10 - Estimating a cost function. The controller of the...Ch. 10 - Identifying variable-, fixed-, and mixed-cost...Ch. 10 - Various cost-behavior patterns. (CPA, adapted)....Ch. 10 - Matching graphs with descriptions of cost and...Ch. 10 - Account analysis, high-low. Stein Corporation...Ch. 10 - Account analysis method. Gower, Inc., a...Ch. 10 - Prob. 10.27ECh. 10 - Estimating a cost function, high-low method. Lacy...Ch. 10 - Linear cost approximation. Dr. Young, of Young and...Ch. 10 - Cost-volume-profit and regression analysis....Ch. 10 - Regression analysis, service company. (CMA,...Ch. 10 - High-low, regression. May Blackwell is the new...Ch. 10 - Learning curve, cumulative average-time learning...Ch. 10 - Learning curve, incremental unit-time learning...Ch. 10 - High-low method. Wayne Mueller financial analyst...Ch. 10 - High-low method and regression analysis. Market...Ch. 10 - High-low method; regression analysis. (CIMA,...Ch. 10 - Regression, activity-based costing, choosing cost...Ch. 10 - Interpreting regression results. Spirit...Ch. 10 - Cost estimation, cumulative average-time learning...Ch. 10 - Cost estimation, incremental unit-time learning...Ch. 10 - Regression; choosing among models. Apollo Hospital...Ch. 10 - Multiple regression (continuation of 10-42). After...Ch. 10 - Cost estimation. Hankuk Electronics started...Ch. 10 - Prob. 10.45PCh. 10 - Interpreting regression results, matching time...Ch. 10 - Purchasing department cost drivers, activity-based...Ch. 10 - Purchasing department cost drivers, multiple...
Knowledge Booster


Learn more about
Need a deep-dive on the concept behind this application? Look no further. Learn more about this topic, accounting and related others by exploring similar questions and additional content below.Similar questions
- Refer to Cornerstone Exercise 3.4 for data on Dohini Manufacturing Company’s purchasing cost and number of purchase orders.The controller for Dohini Manufacturing ran regression on the data, and the coefficients shown by the regression program are: Intercept 15,021 (rounded to the nearest dollar)X variable 1 9.74 (rounded to the nearest cent) Required: 1. Construct the cost formula for the purchasing activity showing the fixed cost and the vari-able rate. 2. If Dohini Manufacturing Company estimates that next month will have 430 purchaseorders, what is the total estimated purchasing cost for that month? (Round your answer tothe nearest dollar.)3. What if Dohini Manufacturing wants to estimate purchasing cost for the coming year andexpects 5,340 purchase orders? What will estimated total purchasing cost be? (Round youranswer to the nearest dollar.) What is the total fixed purchasing cost? Why doesn’t it equalthe fixed cost calculated in Requirement 1?arrow_forwardA regression equation is set up, where the dependent variable is total costs and the independent variable is production. A correlation coefficient of 0.70 implies that: The coefficient of determination is negative. The level of production explains 49% of the variation in total costs There is a slightly inverse relationship between production and total costs. A correlation coefficient of 1.30 would produce a regression line with better fit to the data.arrow_forwardWhich of the following statements is true regarding regression analysis? Question 8 options: Regression analysis considers all of the data points for determining the line that best fits the data so it is usually less accurate than the high-low method. Regression analysis helps generate a statistic, called the R-square, which tells how well the line fits the data points. Regression analysis can only be used by manufacturing companies to predict costs. All of the above are true.arrow_forward
- 10-19 A regression equation is set up, where the dependent variable is total costs and the independent variable is production. A correlation coefficient of 0.70 implies that: a. The coefficient of determination is negative. b. The level of production explains 49% of the variation in total costs c. There is a slightly inverse relationship between production and total costs. d. A correlation coefficient of 1.30 would produce a regression line with better fit to the dataarrow_forwardChoose the correct letter of answer On a scattergrap, the diagonal line cuts across two sets of observations, namely: 600:200, and 900:500 which refer to costs and units, respectively. The fixed costs is plotted in the graph at P400. In this case, the variable cost per unit is equal to: a. P1.00b. P1.25c. P1.50d. P1.12arrow_forwardIn response to a request from your immediate supervisor, you have prepared a CVP graphportraying the cost and revenue characteristics of your company’s product and operations.Explain how the lines on the graph and the break-even point would change if ( a ) the selling priceper unit decreased, ( b ) fixed cost increased throughout the entire range of activity portrayed onthe graph, and ( c ) variable cost per unit increased.arrow_forward
- Can you provide samples/examples of tasks for developing the costing and profitability model for a new product? Should include the following: o A table showing the list of the parameters used in your model o A breakdown of the expected production costs and profitability o Calculation of the NPV of expected sales/ profitability o A sensitivity analysis that accounts for changes in any three (3) parameters of your model. o At least two trade-off rules you developed for your product developmentarrow_forwarda) Determine the variable cost per unit and the fixed cost using the high-low method.b) What is the equation of the total mixed cost function?c) Prepare the scatter diagram and insert the trendline or line of best-fit. Use a scaleof 2 cm to represent 1,000 units on the x-axis & 2 cm to represent $50,000 on the yaxis.arrow_forwardConsider the NPV sensitivity analysis reported in the following table (the numbers in the body of the table are dollars). Deviation Cover sales Price Operating cost Discount rate +20% -108,680 -70,765 -180,678 -150,987 +10% -122,783 -98,498 -160,094 -145,876 Base case -150,929 -150,929 -150,929 -150,929 -10% -164,890 -189,756 -125,098 -138,743 -20% -189,428 -200,690 -115,867 -133,987 Range 80,748 129,925 64,811 17,000 A) Which variable is the most risky for the project? Explain why. B) Which variable is the least risky for the project? Explain why. C) If you were told that the probability of any deviation in the risky event you identified in a) was 0.001%, how would that affect the answer you gave in a)?arrow_forward
- Refer to Cornerstone Exercise 3.4 for data on Dohini Manufacturing Companys purchasing cost and number of purchase orders. The controller for Dohini Manufacturing ran regression on the data, and the coefficients shown by the regression program are: Required: 1. Construct the cost formula for the purchasing activity showing the fixed cost and the variable rate. 2. If Dohini Manufacturing Company estimates that next month will have 430 purchase orders, what is the total estimated purchasing cost for that month? (Round your answer to the nearest dollar.) 3. What if Dohini Manufacturing wants to estimate purchasing cost for the coming year and expects 5,340 purchase orders? What will estimated total purchasing cost be? (Round your answer to the nearest dollar.) What is the total fixed purchasing cost? Why doesnt it equal the fixed cost calculated in Requirement 1?arrow_forwardContinuous improvement is the governing principle of a lean accounting system. Following are several performance measures. Some of these measures would be associated with a traditional standard-costing accounting system, and some would be associated with a lean accounting system. a. Materials price variances b. Cycle time c. Comparison of actual product costs with target costs d. Materials quantity or efficiency variances e. Comparison of actual product costs over time (trend reports) f. Comparison of actual overhead costs, item by item, with the corresponding budgeted costs g. Comparison of product costs with competitors product costs h. Percentage of on-time deliveries i. First-time through j. Reports of value- and non-value-added costs k. Labor efficiency variances l. Days of inventory m. Downtime n. Manufacturing cycle efficiency (MCE) o. Unused (available) capacity variance p. Labor rate variance q. Using a sister plants best practices as a performance standard Required: 1. Classify each measure as lean or traditional (standard costing). If traditional, discuss the measures limitations for a lean environment. If it is a lean measure, describe how the measure supports the objectives of lean manufacturing. 2. Classify the measures into operational (nonfinancial) and financial categories. Explain why operational measures are better for control at the shop level (production floor) than financial measures. Should any financial measures be used at the operational level? 3. Suggest some additional measures that you would like to see added to the list that would be supportive of lean objectives.arrow_forwardThe controller for Dohini Manufacturing Company felt that the number of purchase orders alone did not explain the monthly purchasing cost. He knew that nonstandard orders (for example, one requiring an overseas supplier) took more time and effort. He collected data on the number of nonstandard orders for the past 12 months and added that information to the data on purchasing cost and total number of purchase orders. Multiple regression was run on the above data; the coefficients shown by the regression program are: Required: 1. Construct the cost formula for the purchasing activity showing the fixed cost and the variable rate. 2. If Dohini Manufacturing Company estimates that next month will have 430 total purchase orders and 45 nonstandard orders, what is the total estimated purchasing cost for that month? (Round your answer to the nearest dollar.) 3. What if Dohini Manufacturing wants to estimate purchasing cost for the coming year and expects 5,340 purchase orders and 580 nonstandard orders? What will estimated total purchasing cost be? What is the total fixed purchasing cost? Why doesnt it equal the fixed cost calculated in Requirement 2? (Round your answers to the nearest dollar.)arrow_forward
arrow_back_ios
SEE MORE QUESTIONS
arrow_forward_ios
Recommended textbooks for you
 Cornerstones of Cost Management (Cornerstones Ser...AccountingISBN:9781305970663Author:Don R. Hansen, Maryanne M. MowenPublisher:Cengage Learning
 Managerial Accounting: The Cornerstone of Busines...AccountingISBN:9781337115773Author:Maryanne M. Mowen, Don R. Hansen, Dan L. HeitgerPublisher:Cengage Learning
 Essentials Of Business AnalyticsStatisticsISBN:9781285187273Author:Camm, Jeff.Publisher:Cengage Learning,
 Principles of Cost AccountingAccountingISBN:9781305087408Author:Edward J. Vanderbeck, Maria R. MitchellPublisher:Cengage Learning
Cornerstones of Cost Management (Cornerstones Ser...
Accounting
ISBN:9781305970663
Author:Don R. Hansen, Maryanne M. Mowen
Publisher:Cengage Learning
Managerial Accounting: The Cornerstone of Busines...
Accounting
ISBN:9781337115773
Author:Maryanne M. Mowen, Don R. Hansen, Dan L. Heitger
Publisher:Cengage Learning
Essentials Of Business Analytics
Statistics
ISBN:9781285187273
Author:Camm, Jeff.
Publisher:Cengage Learning,
Principles of Cost Accounting
Accounting
ISBN:9781305087408
Author:Edward J. Vanderbeck, Maria R. Mitchell
Publisher:Cengage Learning
How to Estimate Project Costs: A Method for Cost Estimation; Author: Online PM Courses - Mike Clayton;https://www.youtube.com/watch?v=YQ2Wi3Jh3X0;License: Standard Youtube License