
Videos
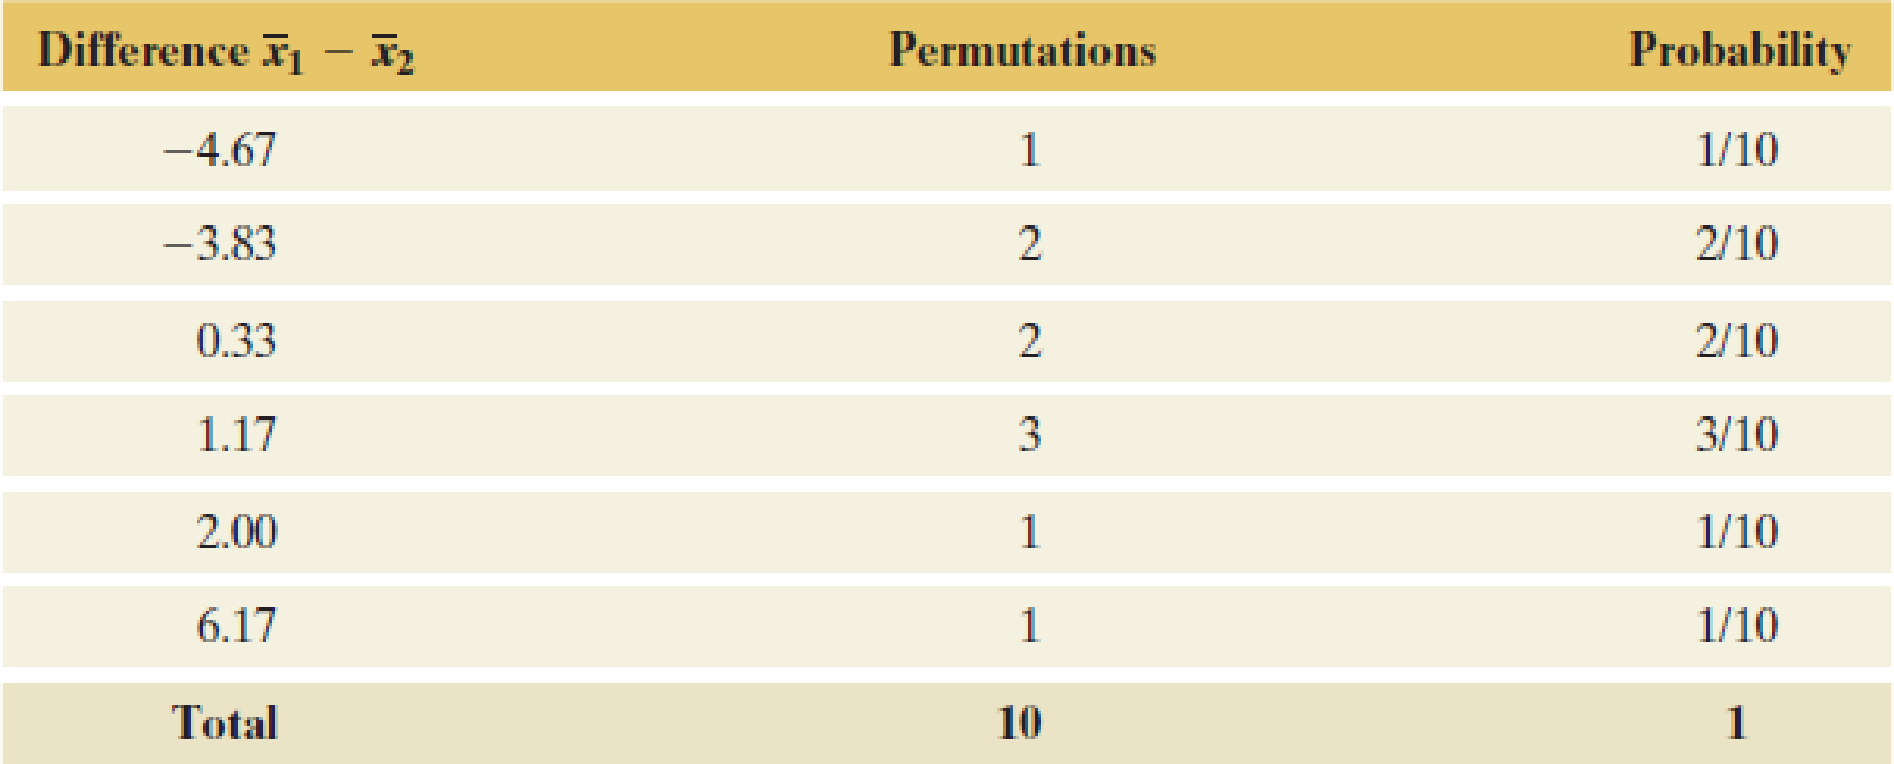
Mean of permutation distribution Refer to Example 11, which compared two doses of a medication in terms of the number of symptom-free days, using a permutation approach. Table 10.13 and Figure 10.9 showed the sampling distribution of the difference in sample means between the two doses. If truly the population distribution of the number of symptom-free days is identical for both doses (the null hypothesis), what value would you expect for the center of the sampling distribution of
Table 10.13 Sampling Distribution of
The table shows each possible difference, how often it occurs among the 10 permutations, and the probability of observing this difference under the null hypothesis.
Want to see the full answer?
Check out a sample textbook solution
Chapter 10 Solutions
EBK STATISTICS


 Calculus For The Life SciencesCalculusISBN:9780321964038Author:GREENWELL, Raymond N., RITCHEY, Nathan P., Lial, Margaret L.Publisher:Pearson Addison Wesley,
 Big Ideas Math A Bridge To Success Algebra 1: Stu...AlgebraISBN:9781680331141Author:HOUGHTON MIFFLIN HARCOURTPublisher:Houghton Mifflin Harcourt
 Glencoe Algebra 1, Student Edition, 9780079039897...AlgebraISBN:9780079039897Author:CarterPublisher:McGraw Hill
 College Algebra (MindTap Course List)AlgebraISBN:9781305652231Author:R. David Gustafson, Jeff HughesPublisher:Cengage Learning