
Perform a test of the null hypothesis at the level of significance of
Answer to Problem 14RE
There is enough evidence to conclude that the numbers are equally likely to come up.
Explanation of Solution
Calculation:
The observed frequencies for 59 Powerball for a sequence of 755 draws are given.
Consider
Step 1:
The hypotheses are:
Null Hypothesis:
That is, each numbers is equally likely to come up.
Alternative Hypothesis:
That is, each numbers is not equally likely to come up.
Step 2:
Expected frequencies:
The expected frequencies are defined as
The total number of trial is obtained as
Thus, the expected frequencies are obtained as,
| Number | Observed Frequencies | Expected frequencies |
| 1 | 15 | |
| 2 | 7 | |
| 3 | 16 | |
| 4 | 11 | |
| 5 | 16 | |
| 6 | 14 | |
| 7 | 17 | |
| 8 | 17 | |
| 9 | 10 | |
| 10 | 14 | |
| 11 | 16 | |
| 12 | 9 | |
| 13 | 16 | |
| 14 | 17 | |
| 15 | 10 | |
| 16 | 14 | |
| 17 | 13 | |
| 18 | 10 | |
| 19 | 13 | |
| 20 | 14 | |
| 21 | 9 | |
| 22 | 14 | |
| 23 | 21 | |
| 24 | 8 | |
| 25 | 6 | |
| 26 | 19 | |
| 27 | 9 | |
| 28 | 14 | |
| 29 | 15 | |
| 30 | 11 | |
| 31 | 11 | |
| 32 | 12 | |
| 33 | 11 | |
| 34 | 11 | |
| 35 | 11 | |
| 36 | 17 | |
| 37 | 6 | |
| 38 | 8 | |
| 39 | 15 | |
| 40 | 10 | |
| 41 | 16 | |
| 42 | 9 | |
| 43 | 13 | |
| 44 | 15 | |
| 45 | 11 | |
| 46 | 16 | |
| 47 | 9 | |
| 48 | 13 | |
| 49 | 13 | |
| 50 | 11 | |
| 51 | 9 | |
| 52 | 12 | |
| 53 | 12 | |
| 54 | 12 | |
| 55 | 17 | |
| 56 | 18 | |
| 57 | 13 | |
| 58 | 13 | |
| 59 | 16 |
Here, all the expected frequencies are more than 5. Hence, the goodness-of-fit test can be applicable.
Step 3:
Level of significance:
The level of significance is given as 0.05.
Step 4:
Chi-Square statistic:
The chi-square statistic is obtained as
Now,
| Number | Observed frequencies (O) | Expected frequencies (E) | ||
| 1 | 15 | 12.79 | 4.8841 | 0.381869 |
| 2 | 7 | 12.79 | 33.5241 | 2.621118 |
| 3 | 16 | 12.79 | 10.3041 | 0.805637 |
| 4 | 11 | 12.79 | 3.2041 | 0.250516 |
| 5 | 16 | 12.79 | 10.3041 | 0.805637 |
| 6 | 14 | 12.79 | 1.4641 | 0.114472 |
| 7 | 17 | 12.79 | 17.7241 | 1.385778 |
| 8 | 17 | 12.79 | 17.7241 | 1.385778 |
| 9 | 10 | 12.79 | 7.7841 | 0.608608 |
| 10 | 14 | 12.79 | 1.4641 | 0.114472 |
| 11 | 16 | 12.79 | 10.3041 | 0.805637 |
| 12 | 9 | 12.79 | 14.3641 | 1.123073 |
| 13 | 16 | 12.79 | 10.3041 | 0.805637 |
| 14 | 17 | 12.79 | 17.7241 | 1.385778 |
| 15 | 10 | 12.79 | 7.7841 | 0.608608 |
| 16 | 14 | 12.79 | 1.4641 | 0.114472 |
| 17 | 13 | 12.79 | 0.0441 | 0.003448 |
| 18 | 10 | 12.79 | 7.7841 | 0.608608 |
| 19 | 13 | 12.79 | 0.0441 | 0.003448 |
| 20 | 14 | 12.79 | 1.4641 | 0.114472 |
| 21 | 9 | 12.79 | 14.3641 | 1.123073 |
| 22 | 14 | 12.79 | 1.4641 | 0.114472 |
| 23 | 21 | 12.79 | 67.4041 | 5.270063 |
| 24 | 8 | 12.79 | 22.9441 | 1.793909 |
| 25 | 6 | 12.79 | 46.1041 | 3.604699 |
| 26 | 19 | 12.79 | 38.5641 | 3.015176 |
| 27 | 9 | 12.79 | 14.3641 | 1.123073 |
| 28 | 14 | 12.79 | 1.4641 | 0.114472 |
| 29 | 15 | 12.79 | 4.8841 | 0.381869 |
| 30 | 11 | 12.79 | 3.2041 | 0.250516 |
| 31 | 11 | 12.79 | 3.2041 | 0.250516 |
| 32 | 12 | 12.79 | 0.6241 | 0.048796 |
| 33 | 11 | 12.79 | 3.2041 | 0.250516 |
| 34 | 11 | 12.79 | 3.2041 | 0.250516 |
| 35 | 11 | 12.79 | 3.2041 | 0.250516 |
| 36 | 17 | 12.79 | 17.7241 | 1.385778 |
| 37 | 6 | 12.79 | 46.1041 | 3.604699 |
| 38 | 8 | 12.79 | 22.9441 | 1.793909 |
| 39 | 15 | 12.79 | 4.8841 | 0.381869 |
| 40 | 10 | 12.79 | 7.7841 | 0.608608 |
| 41 | 16 | 12.79 | 10.3041 | 0.805637 |
| 42 | 9 | 12.79 | 14.3641 | 1.123073 |
| 43 | 13 | 12.79 | 0.0441 | 0.003448 |
| 44 | 15 | 12.79 | 4.8841 | 0.381869 |
| 45 | 11 | 12.79 | 3.2041 | 0.250516 |
| 46 | 16 | 12.79 | 10.3041 | 0.805637 |
| 47 | 9 | 12.79 | 14.3641 | 1.123073 |
| 48 | 13 | 12.79 | 0.0441 | 0.003448 |
| 49 | 13 | 12.79 | 0.0441 | 0.003448 |
| 50 | 11 | 12.79 | 3.2041 | 0.250516 |
| 51 | 9 | 12.79 | 14.3641 | 1.123073 |
| 52 | 12 | 12.79 | 0.6241 | 0.048796 |
| 53 | 12 | 12.79 | 0.6241 | 0.048796 |
| 54 | 12 | 12.79 | 0.6241 | 0.048796 |
| 55 | 17 | 12.79 | 17.7241 | 1.385778 |
| 56 | 18 | 12.79 | 27.1441 | 2.122291 |
| 57 | 13 | 12.79 | 0.0441 | 0.003448 |
| 58 | 13 | 12.79 | 0.0441 | 0.003448 |
| 59 | 16 | 12.79 | 10.3041 | 0.805637 |
| Total | 755 | 639.5619 | 50.00484 |
Thus, the value of
Degrees of freedom:
It is known that under the null hypothesis
In the given question there are 59 categories (balls are numbered from 1 to 59). Thus,
Hence, the degrees of freedom is
Thus, the degrees of freedom is 58.
Step 5:
Critical value:
In a test of hypotheses the critical value is the point by which one can reject or accept the null hypothesis.
Software procedure:
Step-by-step software procedure to obtain critical value using MINITAB software is as follows:
- Select Graph > Probability distribution plot > view probability.
- Select Chi -Square under distribution.
- In Degrees of freedom, enter 58.
- Choose Probability Value and Right Tail for the region of the curve to shade.
- Enter the Probability value as 0.05 under shaded area.
- Select OK.
- Output using MINITAB software is given below:
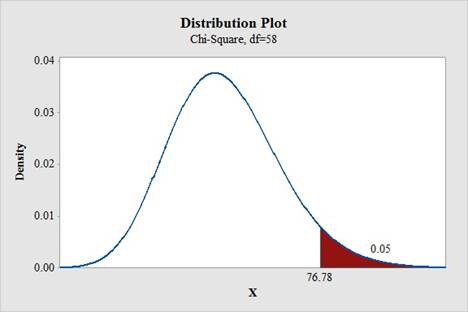
Hence, the critical value at
Rejection rule:
If the
Step 6:
Conclusion:
Here, the
That is,
Thus, the decision is “fail to reject the null hypothesis”.
Thus, there is enough evidence to conclude that the numbers are equally likely to come up.
Want to see more full solutions like this?
Chapter 10 Solutions
ESSENTIAL STATISTICS W/CONNECT

 MATLAB: An Introduction with ApplicationsStatisticsISBN:9781119256830Author:Amos GilatPublisher:John Wiley & Sons Inc
 Probability and Statistics for Engineering and th...StatisticsISBN:9781305251809Author:Jay L. DevorePublisher:Cengage Learning
 Statistics for The Behavioral Sciences (MindTap C...StatisticsISBN:9781305504912Author:Frederick J Gravetter, Larry B. WallnauPublisher:Cengage Learning
 Elementary Statistics: Picturing the World (7th E...StatisticsISBN:9780134683416Author:Ron Larson, Betsy FarberPublisher:PEARSON
 The Basic Practice of StatisticsStatisticsISBN:9781319042578Author:David S. Moore, William I. Notz, Michael A. FlignerPublisher:W. H. Freeman
 Introduction to the Practice of StatisticsStatisticsISBN:9781319013387Author:David S. Moore, George P. McCabe, Bruce A. CraigPublisher:W. H. Freeman