
Videos
(a)
Find the mean difference
(a)
Answer to Problem 16CAP
The mean difference for the difference scores is –0.8.
The standard deviation for the difference scores is 2.8.
The standard error for the difference scores is 1.3.
Explanation of Solution
Calculations:
From the Question 15, the difference scores are –4, 1, –2, –2, and 3.
The formula for sample mean difference score is,
The formula for sample standard deviation difference score is,
The formula for sample standard error of difference score is,
Mean for the difference:
Substitute, the values for difference scores, –4, 1, –2, –2, 3 and
Thus, the mean for the difference scores is –0.8.
Standard deviation for the difference scores:
Substitute, the values for difference scores, –4, 1, –2, –2, 3,
Thus, the standard deviation for the difference scores is 2.8.
Standard error for the difference scores:
Substitute,
Thus, the standard error for the difference scores is 1.3.
(b)
Sketch the shape of the distribution of mean difference scores
(b)
Answer to Problem 16CAP
The shape of the distribution of mean difference scores
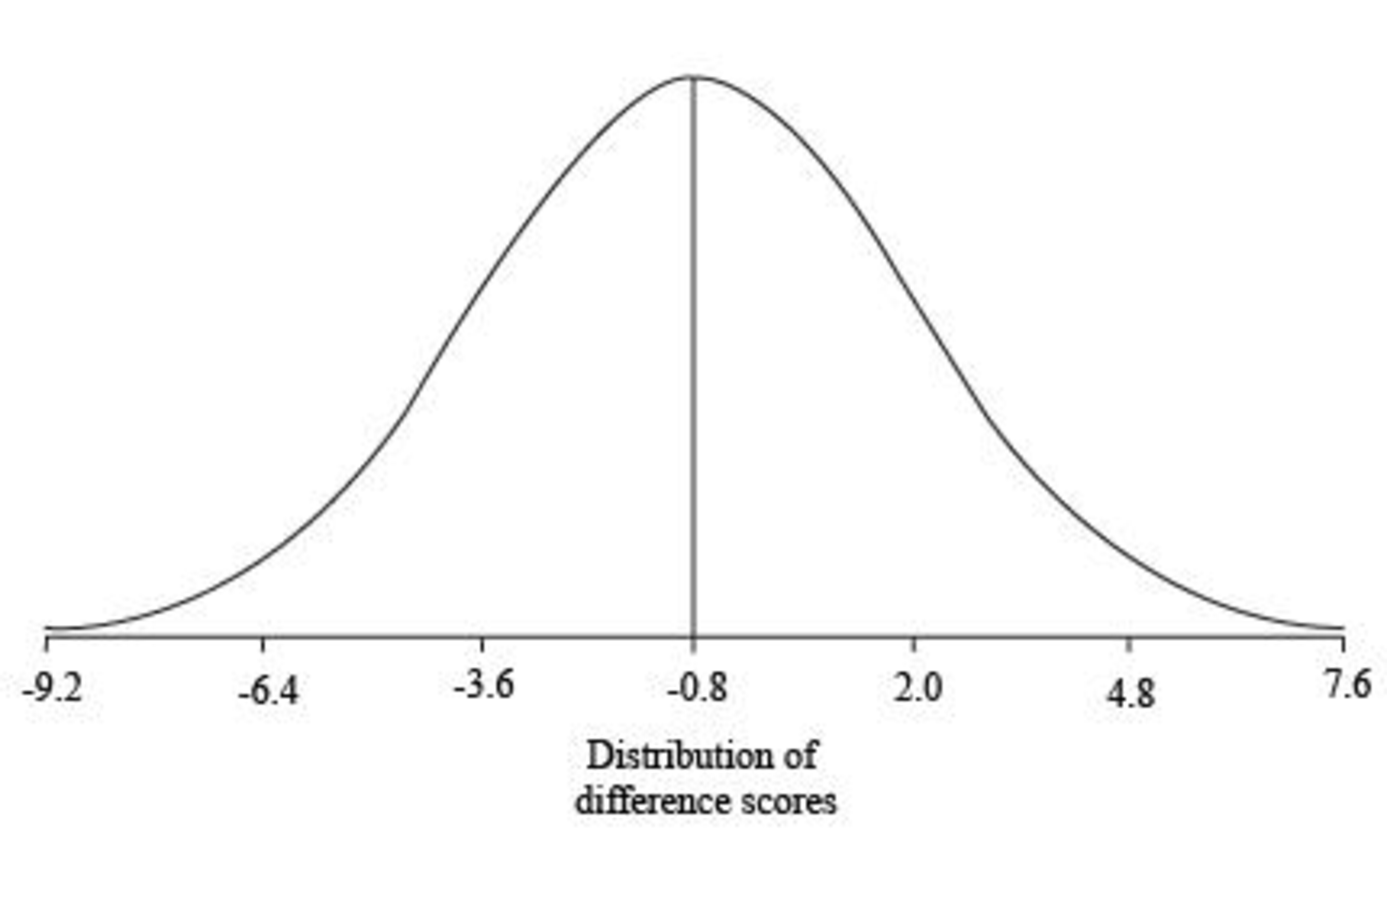
Explanation of Solution
Calculation:
The value of
For 1 standard deviation:
For two standard deviation:
For three standard deviation:
Thus, the standard deviation limits for the distribution are
Sketch of Graph:
Step by step procedure for sketching the graph:
- The mean of the distribution is taken in the centre of the graph.
- The one standard deviation limits are taken on either side of the mean.
- The two standard deviations limits are taken on either side of one standard deviation limits.
- The three standard deviations limits are taken on either side of two standard deviations limits.
(c)
Sketch the shape of the distribution of mean difference scores
(c)
Answer to Problem 16CAP
The shape of the distribution of mean difference scores
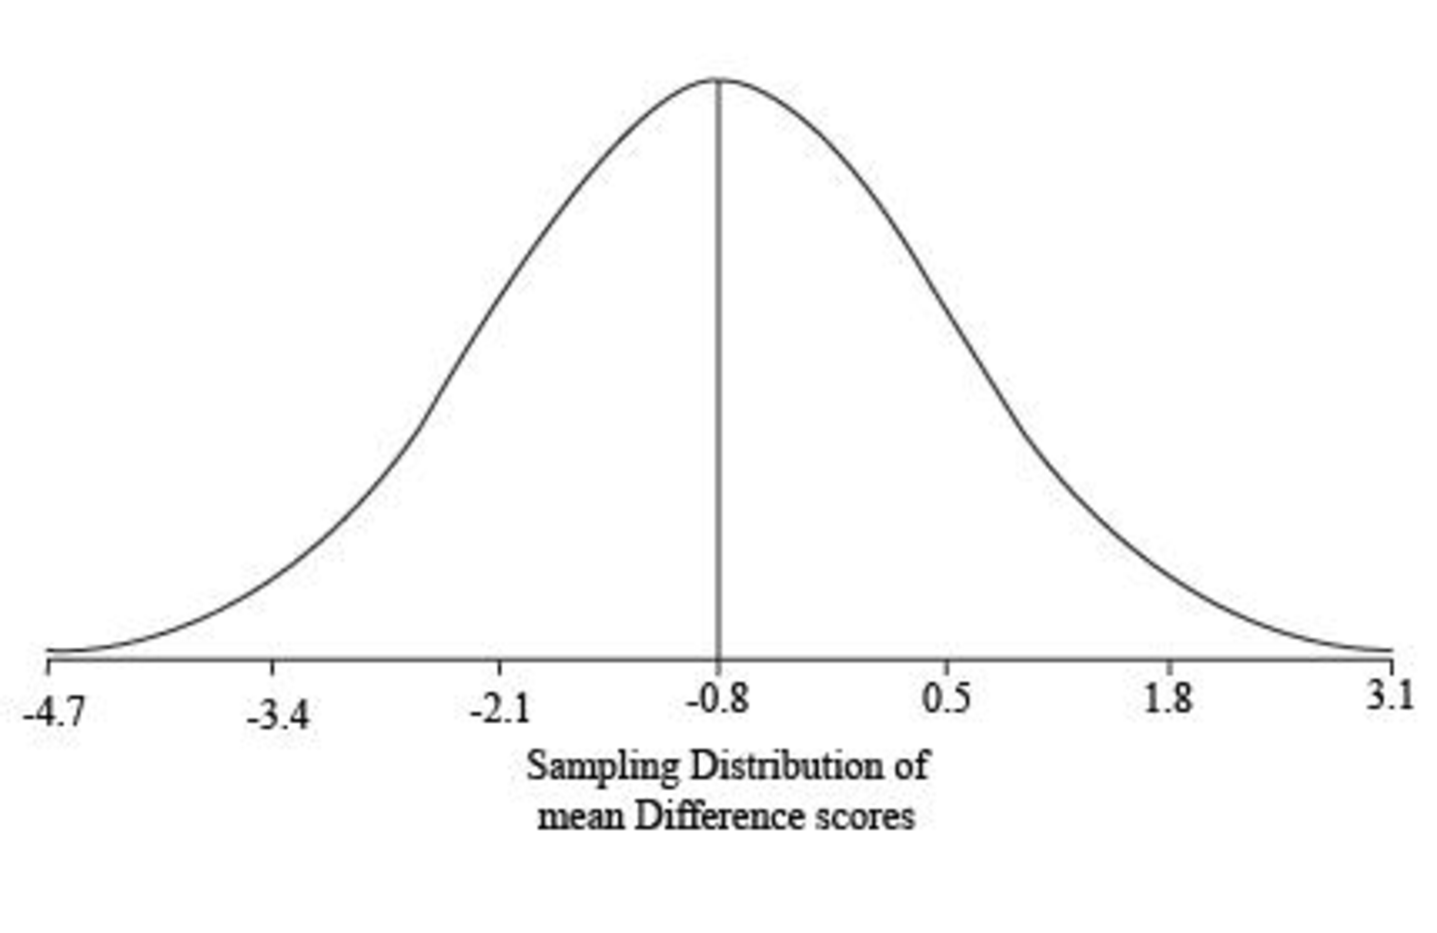
Explanation of Solution
Calculation:
The value of
For 1 standard deviation:
For two standard deviation:
For three standard deviation:
Thus, the standard deviation limits for the distribution are
Sketch of Graph:
Step by step procedure for sketching the graph:
- The mean of the distribution is taken in the centre of the graph.
- The one standard deviation limits are taken on either side of the mean.
- The two standard deviations limits are taken on either side of one standard deviation limits.
- The three standard deviations limits are taken on either side of two standard deviations limits.
Want to see more full solutions like this?
Chapter 10 Solutions
Statistics for the Behavioral Sciences


 College Algebra (MindTap Course List)AlgebraISBN:9781305652231Author:R. David Gustafson, Jeff HughesPublisher:Cengage Learning