
Videos
(a)
Test whether obese patients has consumed more calories than normal weight siblings or not.
State the test statistic value and make a decision to retain or reject the null hypothesis at 0.05, level of significance.
(a)
Answer to Problem 22CAP
The test statistic value is –1.082.
The decision is to retain the null hypothesis.
The obese patients consumed did not significantly consume more calories than their normal-weight siblings.
Explanation of Solution
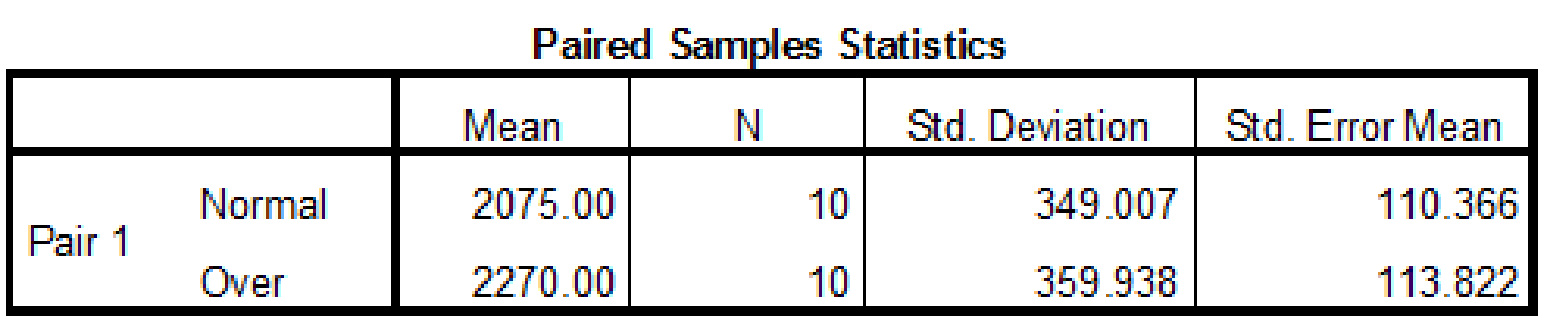
The given information is that, sample of 20 obese patientsis considered in which there are two types of sibling are there normal and overweight siblings. The claim is the obese patients consumed significantly more calories than their normal-weight siblings. This represents the alternative hypothesis. The level of significance is 0.05.
The formula of test statistic for one-sample t test is,
In the formula,
Decision rules:
- If the test statistic value is greater than the critical value, then reject the null hypothesis or else retain the null hypothesis.
- If the negative test statistic value is less than negative critical value, then reject the null hypothesis or else retain the null hypothesis.
Let
Null hypothesis:
That is, the obese patients consumed did not significantly consume more calories than their normal-weight siblings.
Alternative hypothesis:
That is, the obese patients consumed significantly consume more calories than their normal-weight siblings.
The degrees of freedom for t distribution is
Critical value:
The given significance level is
The test is one tailed, the degrees of freedom are 9, and the alpha level is 0.05.
From the Appendix B: Table B.2 the t Distribution:
- Locate the value 5 in the degrees of freedom (df) column.
- Locate the 0.05 in the proportion in one tails combined row.
- The intersecting value that corresponds to the 9 with level of significance 0.05 is –1.833.
Thus, the critical value for
Software procedure:
Step by step procedure to obtain test statistic value using SPSS software is given as,
- Choose Variable view.
- Under the name, enter the name as Times.
- Choose Data view, enter the data.
- Choose Analyze>Compare means>Paired Samples T Test.
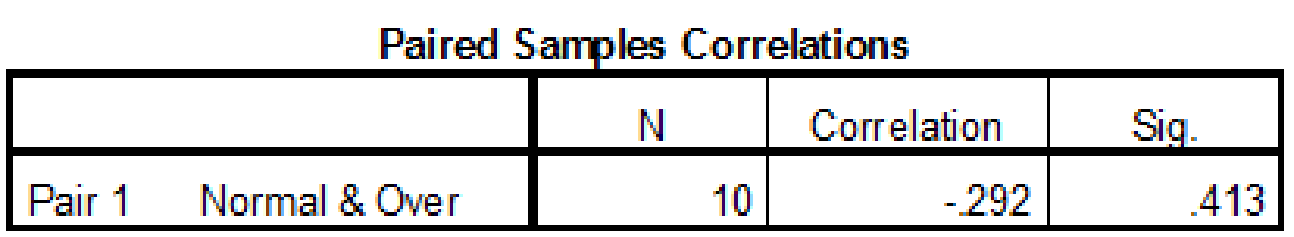
- In Paired variables, enter the Variable 1 as Normal.
- Enter the Variable 2 as Over.
- Click OK.
Output using SPSS software is given below:
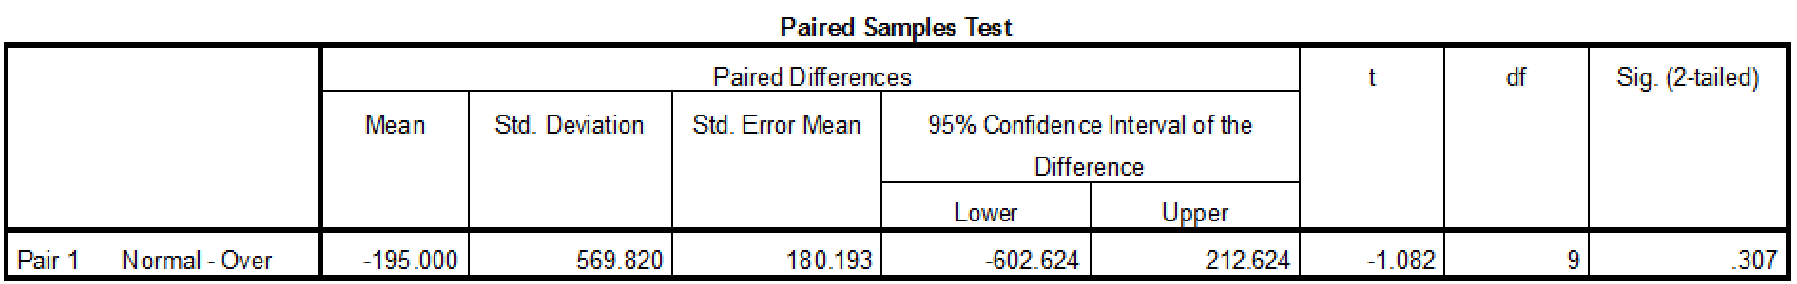
Thus, the test statistic value is –1.082.
Conclusion:
The value of test statistic is –1.082.
The critical value is –1.833.
The test statistic value is greater than the critical value.
The test statistic value does not fall under critical region.
Hence the null hypothesis is retained and obese patients consumed did not significantly consume more calories than their normal-weight siblings.
(b)
Compute effect size using omega-squared.
(b)
Answer to Problem 22CAP
The effect size using omega-squared is 0.02.
Explanation of Solution
Calculations:
From the SPSS output, the test statistic value is –1.082 and
Omega-square:
The proportion of variance is also measured using omega-square. The bias that is caused by eta-square is corrected by omega-squared. The value of omega-square is conservation and give small estimate of proportion of variance. It is denoted by
In the formula, t is the value of test statistic and df is the corresponding degrees of freedom. Subtracting 1 in the numerator reduces the effect size.
The description of effect size using omega-square:
- If value of omega-square is less than 0.01, then effect size is trivial.
- If value of omega-square is in between 0.01 and 0.09, then effect size is small.
- If value of omega-square is in between 0.10 and 0.25, then effect size is medium.
- If value of omega-square is greater than 0.25, then effect size is large.
Substitute,
Thus, the proportion of variance using omega-squared is 0.02. This value is in between 0.01 and 0.09. Hence the Omega-square has a small effect size.
(c)
Explain whether the results support the researcher’s hypothesis or not.
(c)
Answer to Problem 22CAP
No, the results do not support the researcher’s hypothesis.
Explanation of Solution
Justification: The decision of the test is that the obese patients did not consume significantly more calories than their normal-weight siblings. That is, there is no difference in the consumption of calories between obese patients and normal weight siblings.
But the researcher has claimed that ‘the obese patients consumed significantly more calories than their normal-weight siblings’. Hence, the researcher’s hypothesis is not supported.
Want to see more full solutions like this?
Chapter 10 Solutions
Statistics for the Behavioral Sciences


- A small university town has four local food restaurants that make deliveries. A group of marketing students were assigned to do a research project for their class assignment to compare how promptly the four restaurants deliver. On randomly chosen days, they order a chicken rice set from each restaurant, then record the elapsed time until the chicken rice set delivered to their college. Assume that their college is approximately the same distance from the four restaurants. The data are analysed using SPSS and the results are illustrated in Table 2a and 2b. question: Complete the ANOVA table (Table 2b) and calculate theF-ratio.arrow_forwardMatch the alternative hypothesis shown above with its graph shown below.arrow_forwardIf I were to design an experiment to see if students in their 20s can run the mile faster than faculty in their 30s, 40s, 50s, and 60s. How hot it is the moment of the test would be an ___________ variable. If, in the above experiment, only one person were able to run on the track at a time, which strategy would be recommended to minimize the impact of any changing extraneous variables throughout the day? Thank youarrow_forward
- Based on teh attached data, does it appear that magnets reduce backpain?arrow_forwardInfants, even newborns, prefer to look at attractive faces compared to less attractive faces (Slater, et al., 1998). In the study, infants from 1 to 6 days old were shown two photographs of women’s faces. Previously, a group of adults had rated one of the faces as significantly more attractive than the other. The babies were positioned in front of a screen on which the photographs were presented. The pair of faces remained on the screen until the baby accumulated a total of 20 seconds of looking at one or the other. The number of seconds looking at the attractive face was recorded for each infant. Suppose that the study used a sample of n = 9 infants and the data produced an average of M = 13 for the attractive face with an estimated standard error sM= 1 (SS = 72). If there were no preference, the 20 seconds should be divided equally between the two photographs. Note that all the available information comes from the sample. Specifically, we do not know the population mean or the…arrow_forwardInfants, even newborns, prefer to look at attractive faces compared to less attractive faces (Slater, et al., 1998). In the study, infants from 1 to 6 days old were shown two photographs of women’s faces. Previously, a group of adults had rated one of the faces as significantly more attractive than the other. The babies were positioned in front of a screen on which the photographs were presented. The pair of faces remained on the screen until the baby accumulated a total of 20 seconds of looking at one or the other. The number of seconds looking at the attractive face was recorded for each infant. Suppose that the study used a sample of n = 9 infants and the data produced an average of M = 13 for the attractive face with an estimated standard error sM= 1 (SS = 72). If there were no preference, the 20 seconds should be divided equally between the two photographs. Note that all the available information comes from the sample. Specifically, we do not know the population mean or the…arrow_forward
- 6) part 4. Generate a abo plot for the asteroid data.arrow_forwardpart e asks to choose one of the box plotsarrow_forwardAccording to a newspaper study of more than 1 million medical dispatches from 2007 to 2012, the 911 response time for medical aid varies dramatically across a city. Under national standards adopted by the city's fire department, rescuers are supposed to arrive within six minutes to almost all medical emergencies. But the newspaper analysis found that in affluent hillside communities of the city, firefighters failed to hit that mark nearly 85% of the time. The following data show the response times, in minutes, for 10 emergency calls in the Griffith Park neighborhood. 11.8 10.3 10.7 10.6 11.5 8.3 10.5 10.9 10.7 11.2 Based on this sample of ten response times, compute the descriptive statistics (in minutes) in parts (a) and (b) and then answer the questions in parts (c) and (d). (a) mean, median, and mode (in min) mean minmedian minmode min (b) range and standard deviation (in min) (Round your answers to four decimal places.) range minstandard deviation min (c) Compute…arrow_forward
- An observer at a busy bus stop did a 30-minute study of 3 buses. Given the following -Alight time =2 sec -Board time=3 sec -Door opening time =5 sec Determine the dwell time for the 3 busesarrow_forwardA study is made for a particular allergy medication in order to determine the length of relief it provides Y (in hours) in relation to the dosage of medication X (in mg). For this reason, ten patients were given different doses of the medication and were asked to report back when the medication seemed to wear off. Patient #1 #2 #3 #4 #5 #6 #7 #8 #9 #10 Dosage (x) Relief Hours (y) 3 3.5 4 5 6 6.5 7 8 8.5 9 9.1 5.5 12.3 9.2 14.2 16.8 22.0 18.3 24.5 22.7 (i) Draw a scatter diagram. (ii) Calculate the product moment correlation coefficient and comment on your answer. (iii) Construct the least squares regression line.arrow_forwardA researcher is interested in the relationship between a dolphin's lifespan and the dolphin's location of origin After collecting data and conducting an analyses, the researcher is ready to claim that location of origin significantly affects the length of the lifespan of the dolphin.In the situation above, what is the location of origin? _______________________In the situation above, what is the lifespan of the dolphin? _________________________arrow_forward
 Mathematics For Machine TechnologyAdvanced MathISBN:9781337798310Author:Peterson, John.Publisher:Cengage Learning,
 Glencoe Algebra 1, Student Edition, 9780079039897...AlgebraISBN:9780079039897Author:CarterPublisher:McGraw Hill