Videos
Feasible Region All parts of this problem refer to the following feasible region and objective function.
- (a) Graph the feasible region.
- (b) On your graph from part (a), sketch the graphs of the linear equations obtained by setting P equal to 40, 36, 32, and 28.
- (c) If you continue to decrease the value of P, at which vertex of the feasible region will these lines first touch the feasible region?
- (d) Verify that the maximum value of P on the feasible region occurs at the vertex you chose in part (c).
(a)
To sketch: The graph of the given feasible region and the objective function.
Explanation of Solution
The given feasible region with the objective function is,
The Production function is,
Now, take the equalities of the equation (1),
And,
And,
And,
Substitute y for x in the equation (3),
Substitute 4 for x in the equation (2),
The intersection point is
Substitute
Substitute 5 for x in the equation (2),
Thus, the intersection point is
Now, get the value of y in terms of x from the equation (4),
Substitute
Further solve the above equation
Substitute 8 for x in equation (5),
The intersection point is
Now, draw the graph of the above equations,
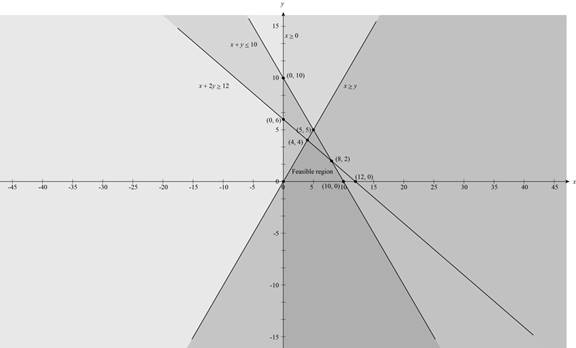
Figure (1)
Thus, the vertices which lies in the feasible region is
(b)
To sketch: The graph at the fix value of
Explanation of Solution
The given feasible region with the objective function is,
The Production function is,
Substitute 40 for P in the equation production function
Substitute 36 for P in the equation production function
Substitute 32 for P in the equation production function
Substitute 28 for P in the equation production function
Now, draw the graph of the above equations,
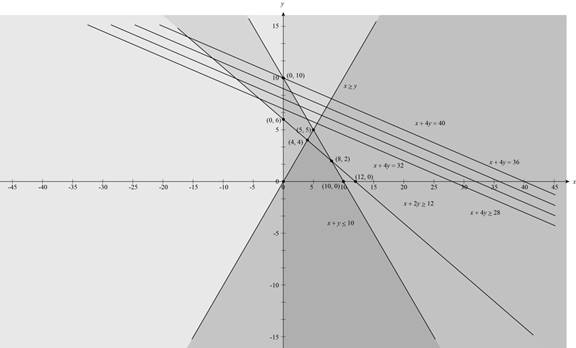
Figure (2)
Figure (2) shows the graph at points 40, 36, 32 and 28.
(c)
To find: The vertex at which the value of P keeps decreases and first touch the line of the feasible region.
Answer to Problem 16P
The vertex at which the value of P keeps decreases and first touches the line of the feasible region. is
Explanation of Solution
Given:
The given feasible region with the objective function is,
The Production function is,
From the graph part (b), the value of the P decreases with respect to the line
Thus, the vertex at which the value of P keeps decreases and first touches the line of the feasible region. is
(d)
To verify: The maximum value of P on the feasible region occurs at the point
Explanation of Solution
Proof:
The given feasible region with the objective function is,
The Production function is,
The vertices which lies in the feasible region is
| Vertices |
|
|
|
|
|
|
|
|
|
|
|
|
|
Hence, the maximum value of
Chapter 10 Solutions
Precalculus: Mathematics for Calculus - 6th Edition


 Calculus: Early TranscendentalsCalculusISBN:9781285741550Author:James StewartPublisher:Cengage Learning
 Thomas' Calculus (14th Edition)CalculusISBN:9780134438986Author:Joel R. Hass, Christopher E. Heil, Maurice D. WeirPublisher:PEARSON
 Calculus: Early Transcendentals (3rd Edition)CalculusISBN:9780134763644Author:William L. Briggs, Lyle Cochran, Bernard Gillett, Eric SchulzPublisher:PEARSON
 Calculus: Early TranscendentalsCalculusISBN:9781319050740Author:Jon Rogawski, Colin Adams, Robert FranzosaPublisher:W. H. Freeman
 Calculus: Early Transcendental FunctionsCalculusISBN:9781337552516Author:Ron Larson, Bruce H. EdwardsPublisher:Cengage Learning