Videos
To graph: the given inequality.
Answer to Problem 14E

Explanation of Solution
Given:
Calculation:
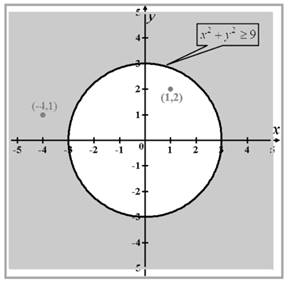
Consider the inequality
Graph the inequality
To graph the inequality
Clearly, the points on the line itself satisfy the inequality because, the inequality contains
To determine whether the inside or outside region of the circle satisfies the inequality, use the test points
Substitute the coordinates of each point in the inequality and check whether the result satisfies the inequality.
The computations are tabulated as shown below:
| Test point | Conclusion | |
| Not a part of the graph | ||
| Part of the graph |
From the above table, observe that the points outside the circle are satisfies the inequality.
So, shade the region outside the circle on the graph.
The graph of the inequality
Conclusion:
Therefore, the graph of inequality is drawn.
Chapter 10 Solutions
Precalculus: Mathematics for Calculus - 6th Edition


 Calculus: Early TranscendentalsCalculusISBN:9781285741550Author:James StewartPublisher:Cengage Learning
 Thomas' Calculus (14th Edition)CalculusISBN:9780134438986Author:Joel R. Hass, Christopher E. Heil, Maurice D. WeirPublisher:PEARSON
 Calculus: Early Transcendentals (3rd Edition)CalculusISBN:9780134763644Author:William L. Briggs, Lyle Cochran, Bernard Gillett, Eric SchulzPublisher:PEARSON
 Calculus: Early TranscendentalsCalculusISBN:9781319050740Author:Jon Rogawski, Colin Adams, Robert FranzosaPublisher:W. H. Freeman
 Calculus: Early Transcendental FunctionsCalculusISBN:9781337552516Author:Ron Larson, Bruce H. EdwardsPublisher:Cengage Learning